Module 64 - CSE202
Module CSE202: Introduction to Cybersecurity for Transportation Agencies
HTML of the PowerPoint Presentation
(Note: This document has been converted from a PowerPoint presentation to 508-compliant HTML. The formatting has been adjusted for 508 compliance, but all the original text content is included, plus additional text descriptions for the images, photos and/or diagrams have been provided below.)
Slide 1:
Slide 2:
Slide 3:
Module CSE202:
Introduction to Cybersecurity for Transportation Agencies

Graphics: Ralph W. Boaz
Slide 4:
Instructors

Ralph W. Boaz
President
Pillar Consulting, Inc.

Bruce S. Eisenhart
Vice President Operations
Consensus Systems Technologies Corporation
Slide 5:
Learning Objectives
- Recognize the need for cybersecurity
- Describe the NIST Cybersecurity Framework
- Apply the Cybersecurity Framework to your organization
- Identify resources for information sharing
Slide 6:
Learning Objective 1
- Recognize the need for cybersecurity
Slide 7:
Cybersecurity Terminology
-
Cyberspace
- The interdependent network of information technology infrastructures
- Includes the Internet, telecommunications networks, computer systems, and embedded processors and controllers in critical industries

Slide 8:
Cybersecurity Terminology (cont.)
-
Cyber Attack
-
An attack, via cyberspace, targeting an enterprise's use of cyberspace for the purpose of
- disrupting
- disabling,
- destroying, or
- maliciously controlling a computing environment/infrastructure; or
- Destroying the integrity of data or stealing controlled information
-
An attack, via cyberspace, targeting an enterprise's use of cyberspace for the purpose of

Slide 9:
Cybersecurity Terminology (cont.)
-
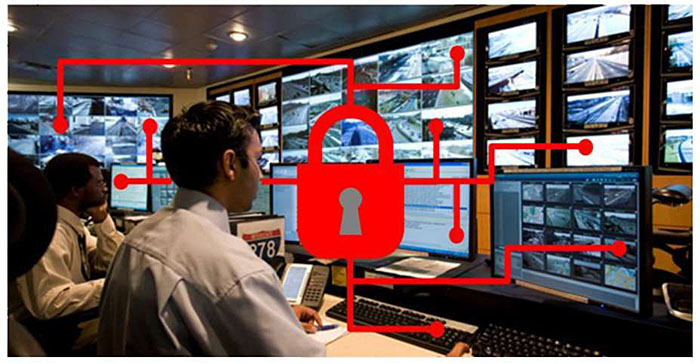
Cybersecurity
- The process of protecting information by preventing, detecting, and responding to attacks
- The ability to protect or defend the use of cyberspace from cyber attacks
Graphics: Ralph W. Boaz
Slide 10:
Cybersecurity Terminology (cont.)
-
Resilience
-
The ability to continue to:
- Operate under adverse conditions or stress, even if in a degraded or debilitated state, while maintaining essential operational capabilities; and
- Recover to an effective operational posture in a time frame consistent with mission needs
- The ability to quickly adapt and recover from any known or unknown changes to the environment through holistic implementation of risk management, contingency, and continuity planning
-
The ability to continue to:
Slide 11:
Cybersecurity Terminology (cont.)
-
Attack Vector
- A path or means by which an attacker can gain unauthorized access to a computer or network to deliver a payload or malicious outcome
- Examples - email attachments, pop-up windows, chat rooms, viruses, text messages, etc.

Slide 12:
Critical Infrastructure
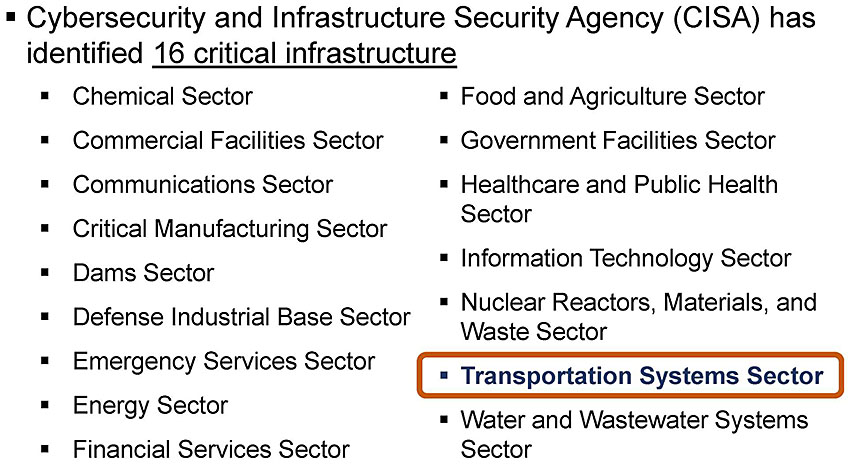
(Extended Text Description: This slide contains a bullet list with the following text and one of the items highlighted as indicated below:
-
Cybersecurity and Infrastructure Security Agency (CISA) has identified 16 critical infrastructure
- Chemical Sector
- Commercial Facilities Sector
- Communications Sector
- Critical Manufacturing Sector
- Dams Sector
- Defense Industrial Base Sector
- Emergency Services Sector
- Energy Sector
- Financial Services Sector
- Food and Agriculture Sector
- Government Facilities Sector
- Healthcare and Public Health Sector
- Information Technology Sector
- Nuclear Reactors, Materials, and Waste Sector
- Transportation Systems Sector
- Water and Wastewater Systems Sector
This slide has an oval that appears around the bulleted item "Transportation Systems Sector" as the instructor presents the slide.)
Slide 13:
Critical Infrastructure
(Extended Text Description: This slide contains a bullet list with the following text and one of the items highlighted as indicated below:
-
Transportation Systems Sector
- Aviation
- Highway and Motor Carrier
- Maritime Transportation
- Mass Transit and Passenger Rail
- Pipeline Systems
- Freight Rail
- Postal and Shipping
This slide has an oval that appears around the bulleted item "Highway and Motor Carrier" as the instructor presents the slide.)
Slide 14:
Critical Infrastructure
(Extended Text Description: This slide contains a bullet list with the following text and two of the items highlighted as indicated below:
-
Highway and Motor Carrier
- Over 4 million miles of interstate highways, strategic highways, arterial roadways and intermodal connectors
- 614,387 bridges
- 519 tunnels
- Trucks (incl. those with hazardous materials)
- Commercial Vehicles (incl. Motor coaches and School Buses)
- Vehicle and licensing systems
- Traffic management systems
- Cyber systems for operational management
This slide has an oval that appears around the bulleted items "Traffic management systems" and "Cyber systems for operational management" as the instructor presents the slide.)
Slide 15:
Scope of Concern for Traffic Operations (Traffic Ops)
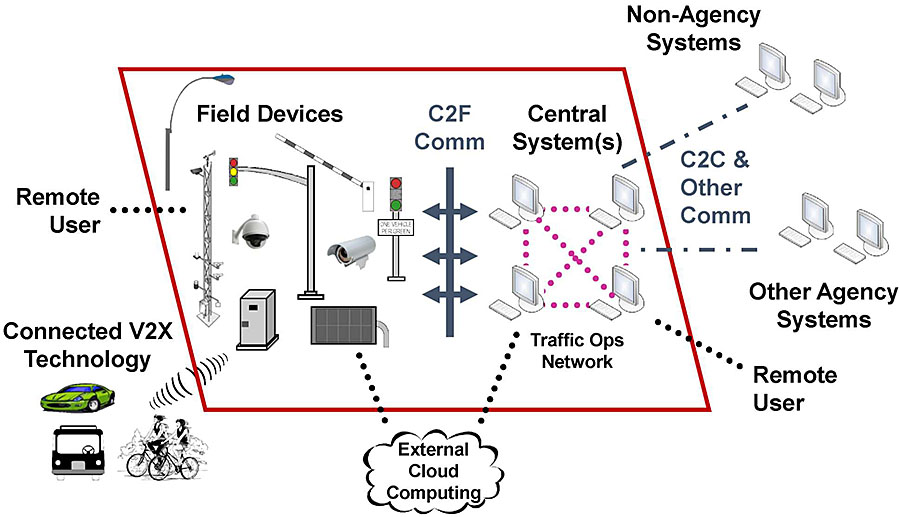
Graphics: Ralph W. Boaz
Slide 16:
Scope of Concern for Traffic Operations (Traffic Ops) (cont.)
Cybersecurity Concerns for Traffic Ops
- Central Systems
- Transportation Field Devices including the infrastructure side of vehicle-to-everything (V2X) communications
- Traffic Ops network and networked devices
- Center-to-field (C2F) communications and equipment
- Any interfaces to systems outside the Traffic Ops network including center-to-center (C2C) and other communications
- Interfaces to Remote Users to devices and of Traffic Ops network
- Interfaces to cloud-based systems not resident on the Traffic Ops network
Slide 17:
Scope of Concern for Traffic Operations (Traffic Ops) (cont.)
Cybersecurity Concerns Outside of Traffic Ops Control
- Vehicles, transit, cyclists, and other modes of transportation
- Systems outside of those used in the Traffic Ops network
- Non-agency systems used by remote users
- Cloud-based systems not resident on the Traffic Ops network
Slide 18:
Sources of Cyber Attacks
- Criminal groups
- Foreign intelligence services
- Hackers
- Insiders
- Others

Slide 19:
Types of Attacks and Threats
- Denial-of-service (DoS) and distributed denial-of-service (DDoS) attacks
- Malware attack (including Ransomware)
- Password attack
- Eavesdropping attack
- Others


Slide 20:
Types of Hackers
- Black Hat
- Grey Hat
- White Hat
- Other types of hackers vary depending on source

Graphics: Ralph W. Boaz

Slide 21:
Vulnerabilities to Traffic Ops Technology
- Use of advanced computing, sensing and communications in roadway systems is increasing to meet operational needs
-
Transportation (Traffic) Controllers
- Older controllers in this environment may not have critical operating system and software patches
-
Modern controllers are Linux computers that may support multiple and concurrent on-street applications
- Greater capability but more vulnerability than older units
-
Modern communications increase attack vectors
- Protocols commonly used do not have security built in (e.g., National Transportation Communications for ITS Protocol, NTCIP)
- Communications are generally not encrypted by other means
Slide 22:
Vulnerabilities to Traffic Ops Technology (cont.)
-
State-sponsored attack
- Could result in signal timing changes, blocked sensor calls and flash conditions
- 2009 report estimated that traffic delays in Los Angeles cost $12.8B per year (approx. $1.46M per hour)
-
Physical vulnerabilities
- Most transportation field cabinet systems use #2 key
- Field equipment sometimes left unlocked
- Infrastructure owner/operators (IOOs) must include cybersecurity in their design and operation of transportation infrastructure
So far, all known hacking into traffic signal systems has been done in a white hat capacity
Slide 23:
Slide 24:
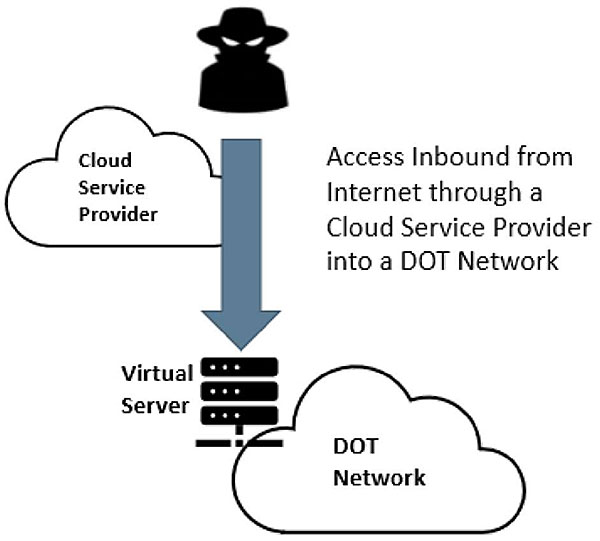
Colorado DOT Ransomware Attack (CDOT) 2018
- Ransomware called SamSam found on CDOT's internal IT system
- 2,000 computers taken offline for several weeks to prevent further damage
- State formed command group to implement a 4-phase approach over several weeks to restore operations
- $1.5 million to undo the damage after refusing to pay the ransom
Slide 25:
Sacramento Regional Transit (SacRT) 2017
- Destroyed 30 million of the system's 100 million files
- 2,000 computers taken offline for several weeks to prevent further damage
- Threatened to do more unless 1 Bitcoin paid (approx. $8,000)
- State formed command group to implement a 4-phase approach over several weeks to restore operations
- $1.5 million to undo the damage after refusing to pay the ransom - about 80% of deleted files recovered
Slide 26:

Slide 27:
Question
Which of the following is a true statement? Answer Choices
- Modern transportation controllers are less sophisticated than other cyber devices and easier to protect
- Cybersecurity is an IT responsibility only
- Traffic Ops needs to protect any external cloud-based systems used
- Transportation infrastructure could be a target for a state-sponsored cyber attack
Slide 28:
Review of Answers
 a) Modern transportation controllers are less sophisticated than other cyber devices and easier to protect
Incorrect. Modern transportation controllers are Linux computers.
 b) Cybersecurity is an IT responsibility only
Incorrect. Cybersecurity is the responsibility of everyone in the organization.
 c) Traffic Ops needs to protect any external cloud-based systems used
Incorrect. Traffic Ops needs to protect the interface to any external cloud based systems used.
 d) Transportation infrastructure could be a target for a state-sponsored cyberattack
Correct. Such an attack could have a high economic impact on a large metropolitan area due to the cost of delay.
Slide 29:
Learning Objective 2
- Describe the NIST Cybersecurity Framework
Slide 30:
NIST Cybersecurity Framework
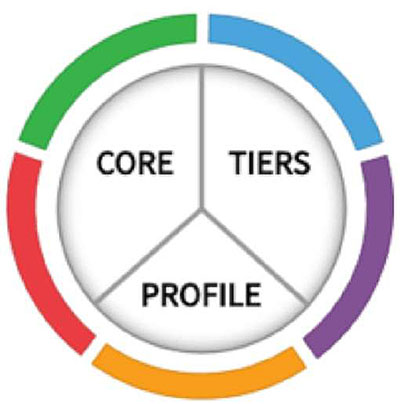
- Created by Executive Order 13636 (EO), "Improving Critical Infrastructure Cybersecurity," 2013
-
Provides
- Approach to identify, assess, and manage cybersecurity risk of critical infrastructure services
- Guidance to organizations on how to plan for and deal with cybersecurity risk
-
Composed of:
- Core
- Implementation Tiers
- Profiles

Slide 31:
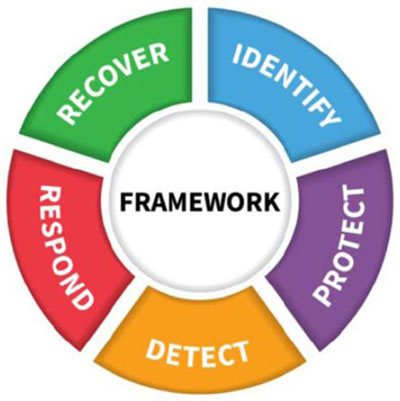
Framework Core
- Identifies cybersecurity activities and desired outcomes
- Applied across all critical infrastructure sectors
- Consists of five concurrent and continuous Functions
Slide 32:
Framework Core
-
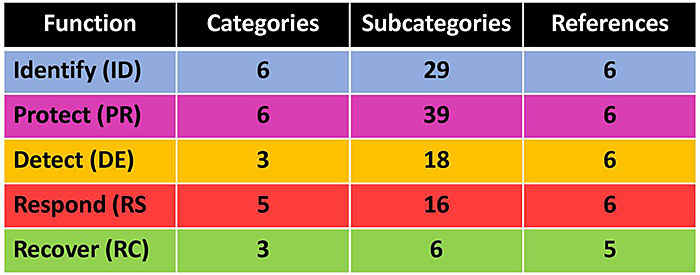
Each Function broken into:
- Categories: Subdivisions of a Function related to needs and activities
- Subcategories: Specific outcomes of activities
- Informative References: Section-level references into 6 key technical documents
(Extended Text Description: This slide contains a table as indicated below:
| Function | Categories | Subcategories | References |
|---|---|---|---|
| Identify (ID) | 6 | 29 | 6 |
| Protect (PR) | 6 | 39 | 6 |
| Detect (DE) | 3 | 18 | 6 |
| Respond (RS | 5 | 16 | 6 |
| Recover (RC) | 3 | 6 | 5 |
Note that the rows of the table are highlighted in corresponding relevant colors to the Framework Core figure on slide 31 with Identify in blue, Protect in purple, Detect in yellow, Respond in red, and Recover in green.)
Slide 33:
Framework Core
-
Categories Example (for Identify Function)
-
Asset Management (ID.AM)
- The data, personnel, devices, systems, and facilities that enable the organization to achieve business purposes are identified and managed consistent with their relative importance to organizational objectives and the organization's risk strategy
- Business Environment (ID.BE)
- Governance (ID.GV)
- Risk Assessment (ID.RA)
- Risk Management Strategy (ID.RM)
- Supply Chain Risk Management (ID.SC)
-
Asset Management (ID.AM)
Slide 34:
Framework Core
-
Example Subcategory under Asset Management
- ID.AM-1: Physical devices and systems within the organization are inventoried
-
Example Informative Reference
- CIS Critical Security Controls (CIS CSC) defines 20 controls that are best practices to mitigate the most common attacks against systems and networks
| Function | Category | Subcategory | Informative References |
|---|---|---|---|
| IDENTIFY (ID) | Asset Management (ID.AM): The data, personnel, devices, systems, and facilities that enable the organization to achieve business purposes are identified and managed consistent with their relative importance to organizational objectives and the organization's risk strategy. | ID.AM-1: Physical devices and systems within the organization are inventoried |
CIS CSC 1 COBIT 5 BAI09.01. BAI09.02 ISA 62443-2-1:2009 4.2.3.4 ISA 62443-3-3:2013 SR 7.8 ISO/IEC 27001:2013 A.8.1.1, A.8.1.2 NIST SP 800-53 Rev. 4 CM-8, PM-5 |
| ID.AM-2: Software platforms and applications within the organization are inventoried |
CIS CSC 2 COBIT 5 BAI09.01. BAI09.02, BAI09.05 ISA 62443-2-1:2009 4.2.3.4 ISA 62443-3-3:2013 SR7.8 ISO/IEC 27001:2013 A.8.1.1, A.8.1.2, A.12.5.1 NIST SP 800-53 Rev. 4 CM-8, PM-5 |
Slide 35:
Framework Core- Identify Function
- Develop an organizational understanding to manage cybersecurity risk to systems, people, assets, data, and capabilities.
-
Categories
- Asset Management
- Business Environment
- Governance
- Risk Assessment
- Risk Management Strategy
- Supply Chain Risk Management

Slide 36:
Framework Core- Identify Function
-
Addresses Information Security and Risk Management
-
Information Security Policy
- Defines processes
- Identify roles and responsibilities
- Consider centers, field devices, and communications between them
-
Risk Management
- Perform risk assessment
- Identify threats and vulnerabilities
- Document risk management processes or strategies
-
Information Security Policy

Slide 37:
Framework Core- Protect Function
- Develop and implement appropriate safeguards to ensure delivery of critical services.
-
Categories
- Identity Management, Authentication and Access Control
- Data Security
- Information Protection Processes and Procedures
- Maintenance
- Protective Technology
- Awareness and Training

Slide 38:
Framework Core- Protect Function
-
Addresses
- Device and system configuration management
- Identify Management, Authentication and Access Control
-
Data Security
- At rest and in transit
- Integrity
-
Information Protection Processes and Procedures
- Backup
- Data destruction
-
Protective technology
- Log and audit records
- Training

Slide 39:
Framework Core- Detect Function
- Develop and implement appropriate activities to identify the occurrence of a cybersecurity event
-
Categories
- Anomalies and Events
- Security Continuous Monitoring
- Detection Processes
Slide 40:
Framework Core- Detect Function
-
Addresses
-
Defining system baseline
- Network operations and expected data flows
- System Monitoring
- Detecting malicious cyber events
- Assessing events
-
Defining system baseline

Slide 41:
Framework Core- Respond Function
- Develop and implement appropriate activities to take action regarding a detected cybersecurity incident.
-
Categories
- Response Planning
- Communications
- Analysis
- Mitigation
- Improvements

Slide 42:
Framework Core- Respond Function
-
Addresses
-
Devise and implement response plan
- Incident response
- Operations continuity
- Assess attack severity
- Incident Reporting (internal and external)
-
Devise and implement response plan

Slide 43:
Framework Core- Recover Function
- Plan for and implement activities to restore any capabilities or services that were impaired due to a cybersecurity incident.
- How resilient are your operations?
-
Categories
- Recovery Planning
- Improvements
- Communications

Slide 44:
Framework Core- Recover Function
-
Addresses
- Disaster recovery plan that is specific to cyber-attack
- Executing the plan following an attack- get your systems back online
- Who to communicate with both internally and externally

Slide 45:

Slide 46:
Question
Which of the following is NOT one of the NIST Functions?
Answer Choices
- Identify
- Defend
- Detect
- Respond
- Recover
Slide 47:
Review of Answers
 a) Identify
Incorrect. One of 5 Framework Functions
 b) Defend
Correct. The actual Framework Function is Protect, which covers a wider range of topics than "defend"
 c) Detect
Incorrect. One of 5 Framework Functions
 d) Respond
Incorrect. One of 5 Framework Functions
 e) Recover
Incorrect: One of 5 Framework Functions.
Slide 48:
Learning Objective 3
- Apply the Cybersecurity Framework to your organization
Slide 49:
Framework Implementation Tiers
-
Framework Implementation Tiers
- Provides context on how an organization views cybersecurity risks and the processes in place to manage that risk
- Describes the degree to which cybersecurity risk management meet the characteristics defined in the Framework
-
Four Tiers
- Tier 1: Partial
- Tier 2: Risk Informed
- Tier 3: Repeatable
- Tier 4: Adaptive

Slide 50:
Tiers Describe Rigor and Sophistication in Cybersecurity Risk Management
-
Risk Management Process
- The functionality and repeatability of cybersecurity risk management practices
-
Integrated Risk Management Program
- The extent to which cybersecurity is considered in broader risk management decisions
-
External Participation
-
The degree to which the organization:
- monitors and manages supply chain risk
- benefits sharing or receiving information from outside parties
-
The degree to which the organization:
Slide 51:
Tier 1: Partial
-
Risk Management Process
- Risk management practices not formalized
- Ad hoc and sometimes reactive
- Inadequate prioritization of cybersecurity activities
-
Integrated Risk Management Program
- Limited awareness of cybersecurity risk at organizational level
- Implementation is irregular, case-by-case basis
- May not have internal processes to share cybersecurity information
-
External Participation
- Organization does not understand its role in the larger ecosystem
- Does not collaborate with or receive information from other entities
Slide 52:
Tier 2: Risk Informed
-
Risk Management Process
- Prioritization of cybersecurity activities is directly informed by risk objectives, threat environment, or mission requirements
- Risk management practices but not organization-wide policy
-
Integrated Risk Management Program
- Awareness of cybersecurity risk at organizational level
- Cybersecurity information is shared internally on an informal basis
- Cybersecurity consideration occurs at some but not all levels
-
External Participation
- Organization understands role in the larger ecosystem with respect to dependencies or dependents, but not both
- Collaborates with and receives some information from other entities
Slide 53:
Tier 3: Repeatable
-
Risk Management Process
- Practices are formally approved and expressed as policy
- Practices regularly updated based on changes in mission requirements and changing threat landscape
-
Integrated Risk Management Program
- Organization-wide approach to manage cybersecurity risk
- Policies, processes, and procedures are defined, implemented, and reviewed
- Cybersecurity risk of assets consistently and accurately monitored
- Senior executives communicate regularly regarding cybersecurity risk
Slide 54:
Tier 3: Repeatable (cont.)
-
External Participation
- Organization understands role, dependencies, and dependents in the larger ecosystem
- Collaborates with other entities regularly receiving information and may share internally-generated information
Slide 55:
Tier 4: Adaptive
-
Risk Management Process
- Continuously improves cybersecurity technologies and practices adapting to a changing threat landscape
-
Integrated Risk Management Program
- Manages cybersecurity risk using risk-informed policies, processes, and procedures to address potential cybersecurity events
- Senior executives monitor cybersecurity risk in the same context as financial risk and other organizational risks
- Organizational budget based on understanding of current and predicted risk environment and risk tolerance
Slide 56:
Tier 4: Adaptive (cont.)
-
External Participation
- Organization understands role, dependencies, and dependents in the larger ecosystem
- Collaborates with other entities regularly receiving information and sharing internally generated information
Slide 57:
Tier Progression
-
When selecting a tier consider the following:
- Current security practices
- Threat environment
- Legal/regulatory environment
- Business/mission objectives
- Agency constraints
- Progression to a higher tier is desirable, but only encouraged when cost-benefit analysis indicates that it is feasible and cost effective
- Tiers support organizational decision making in regards to managing cybersecurity risk
Slide 58:
Framework Core and Tiers

Graphics: Ralph W. Boaz
Slide 59:
Framework Profiles
-
Framework Profiles
- Represents outcomes based on business needs selected from the Framework Functions, Categories and Subcategories
- Enables organizations to establish a roadmap for reducing cybersecurity risk
- "Current Profile" indicates the cybersecurity outcomes currently being achieved
- "Target Profile" indicates the outcomes needed to achieve desired cybersecurity risk management goals
- Comparing the profiles used to support prioritization and measure progress towards Target Profile
Slide 60:
Framework Core and Tiers Help Build Profiles
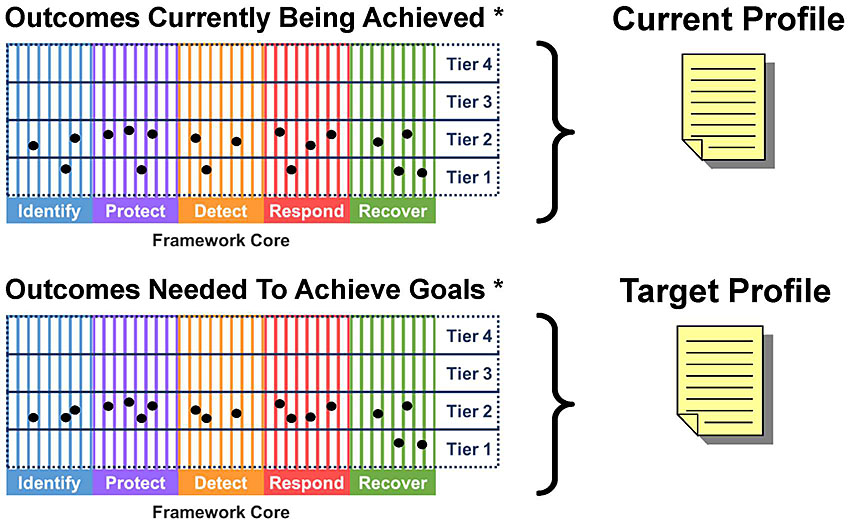
* Charts are conceptual and not intended to reflect the specific contents of a profile.
Graphics: Ralph W. Boaz
Slide 61:
Establishing or Improving a Cybersecurity Program
Step 1: Prioritize and Scope
- Identify business/mission objectives and high-level priorities
- Make decisions regarding cybersecurity implementations and determine the scope of systems and assets that support the selected business line or process
Step 2: Orient
- Identify related systems and assets, regulatory requirements, and overall risk approach
- Consults sources to identify threats and vulnerabilities applicable to those systems and assets
Slide 62:
Establishing or Improving a Cybersecurity Program (cont.)
Step 3: Create a Current Profile
- Develop a Current Profile by indicating which Category and Subcategory outcomes from the Framework Core are currently being achieved
- Noting outcomes that are partially achieved will help support subsequent steps
Step 4: Conduct a Risk Assessment
- Assessment can be guided by the organization's overall risk management process or previous risk assessment activities
- Analyze the operational environment in order to discern the likelihood of a cybersecurity event and the impact
- Important to identify emerging risks and use cyber threat information from internal and external sources
Slide 63:
Establishing or Improving a Cybersecurity Program (cont.)
Step 5: Create a Target Profile
- Develop a Target Profile that focuses on the Framework Categories and Subcategories describing the cybersecurity outcomes desired
- Target Profile should appropriately reflect criteria within the target Implementation Tier.
Step 6: Determine, Analyze, and Prioritize Gaps
- Compares Current Profile and Target Profile to determine gaps
- Create a prioritized action plan to address gaps - reflecting mission drivers, costs and benefits, and risks - to achieve the outcomes in the Target Profile
Slide 64:
Establishing or Improving a Cybersecurity Program (cont.)
-
Step 7: Implement Action Plan
- Determine which actions to take to address the gaps, if any, identified in the previous step and then adjust current cybersecurity practices in order to achieve the Target Profile
Slide 65:
Use the Framework
- Use the Framework as a key part of systematic process for identifying, assessing, and managing cybersecurity risk
- An organization can determine activities that are most important to critical service delivery and prioritize expenditures to maximize the impact of the investment
-
The Framework can be applied to a system and used throughout the systems life cycle
- Cybersecurity needs may be identified starting in the planning stage
- System requirements and subsequent system design follow using a systems engineering process
- Cybersecurity outcomes determined through using the Framework should serve as a basis for ongoing operation of the system
Slide 66:

Slide 67:
Question
Which of the following is a correct statement? Answer Choices
- A Tier represents the maturity level of the organization
- Profiles always represent cybersecurity outcomes currently achieved
- Outcomes from using the Framework should reflect in operations
- Self-assessment is a one-time step at the beginning of a cyber program
Slide 68:
Review of Answers
 a) A Tier represents the maturity level of the organization
Incorrect. Tiers provide context on how an organization views risks.
 b) Profiles always represent cybersecurity outcomes currently achieved
Incorrect. A current profile and a target profile are used to improve cybersecurity risk management.
 c) Outcomes from using the Framework should reflect in operations
Correct! Without this follow-through the cybersecurity program is ineffective.
 d) Self-assessment is a one-time step at the start of a cyber program
Incorrect. Self-assessment is used every time the cyber program is to be improved.
Slide 69:
Learning Objective 4
- Identify resources for information sharing
Slide 70:
What to Report
-
Cyberattacks such as
-
Denial of Service or Malware (including Ransomware)
- Mainly against IT Systems
-
Attacks against operational systems such as traffic signal controllers can have a safety impact and could include:
- Signal timing changes
- Blocked sensor calls
- Flash conditions
-
Denial of Service or Malware (including Ransomware)

Slide 71:
Where to find information and report incidents
Information Sharing and Analysis Centers (ISACs)
- Help critical infrastructure owners and operators protect their facilities, personnel, and customers from cyber and physical security threats and other hazards.
- ISACs collect, analyze, and disseminate actionable threat information to their members and
- Provide members with tools to mitigate risks and enhance resiliency.
-
Two key ISACs for Transportation
- Multi-state ISAC: MS-ISAC
- Surface Transportation ISAC: ST-ISAC
Slide 72:
Where to find information and report incidents

- Effort of Center for Internet Security (CIS) and the Office of Cybersecurity and Communications DHS
- Mission: To improve the overall cybersecurity posture of the nation's state, local, territorial, and tribal (SLTT) governments through focused cyberthreat prevention, protection, response, and recovery.
-
Members-
- All states
- All Fusion Centers
- Hundreds of local agencies
- https://www.cisecurity.org/ms-isac/
Slide 73:
Where to find information and report incidents

(Extended Text Description: This slide contains a bullet list with the following information:
MS ISAC provides:
- Threat Details
- Identified solutions
-
Threat Reporting 24/7 Systems Operations Center (SOC)
- 866 787 4722
- soc@cisecurity.org
- Computer Emergency Response Team (CERT)
-
Caveat
- MS ISAC focused on IT issues, not ITS equipment issues
This slide has a screen shot image on the right upper corner from the MS-ISAC public website that shows a list of the "Top Malware Last Month". This list of 10 specific Malware is just representative of what members of the ISAC see on the member's website and is meant just to show an example of the type of information members have available. The example list contains the text:
Top Malware Last Month
- Emotet
- Kovter
- ZeuS
- NanoCore
- Cerber
- Gh0st
- CoinMiner
- Trickbot
- WannaCry
- Xtrat
)
Slide 74:
Where to find information and report incidents
ST- ISAC
-
Combination of 3 ISACS for
- Rail
- Public Transit
- Over the Road Bus
-
Provides Information:
- Transit and Rail Intelligence Awareness Daily (TRIAD) Report
- Over the Road Bus (OTRB) Daily Report
- Daily Open Source Cyber Report
-
Submit an Incident
- Trans Alert & Information Network (TRAIN)
- https://www.surfacetransportationisac.org/
Slide 75:
Where to find information and report incidents
Fusion Centers
- Fusion centers operate as state and major urban area focal points for the receipt, analysis, gathering, and sharing of threat-related information
-
Include Fire and EMS
- Check with your contacts in public safety
-
Learn More:
- https://www.dhs.gov/fusion-centers
- National Fusion Center Association https://nfcausa.org
Slide 76:
Where to get help?
Two additional Key Resources:
-
National Cybersecurity and Communications and Integration Center (NCCIC)
- DHS 24x7 operations watch center.
- Cyber situational awareness, incident response, and management center
- https://www.dhs.gov/national-cybersecurity-and-communications-integration-center
-
Industrial Control Systems Cyber Emergency Readiness Team (ICS- CERT)
- Alerts
- Response Teams- can help recover systems
- Focus on recovery
- On-Line Training
- https://us-cert.cisa.gov/ics

Slide 77:

Slide 78:
Question
Which group cannot be a member of MS-ISAC? Answer Choices
- State Transportation Agencies
- Municipal Transportation Agencies
- ITS Vendors
- County transportation agencies
Slide 79:
Review of Answers
 a) State Transportation Agencies
Incorrect. MS ISAC members are made up of public sector agencies.
 b) Municipal Transportation Agencies
Incorrect. MS ISAC members are made up of public sector agencies.
 c) ITS Vendors
Correct MS ISAC only allows public sector members.
 d) County transportation agencies
Incorrect. MS ISAC members are made up of public sector agencies.
Slide 80:
Module Summary
- Recognize the need for cybersecurity
- Describe the NIST Cybersecurity Framework
- Apply the Cybersecurity Framework to your organization
- Identify resources for information sharing
Slide 81:
Thank you for completing this module.
Feedback
Please use the Feedback link below to provide us with your thoughts and comments about the value of the training.
Thank you!