← Back to Module 8
ITS ePrimer Presentation
Module 8: Electronic Toll Collection, Electronic Payment Systems, and Pricing
(Note: The following PowerPoint presentation is a supplement to the module.)
Slide 1: ITS ePrimer Module 8: Electronic Toll Collection, Electronic Payment Systems, and Pricing

September 2013
Intelligent Transportation Systems Joint Program Office Research and Innovative Technology Administration, USDOT
Author Notes for Slide 1:
This is the first, title Slide in all modules.
The following slides are in this order:
- Instructor
- Learning Objectives
- Content-related slide(s)
- Summary (what we have learned)
- References
- Questions?
This module is sponsored by the U.S. Department of Transportation's ITS Professional Capacity Building (PCB) Program. The ITS PCB Program is part of the Research and Innovative Technology Administration's ITS Joint Program Office.
Thank you for participating and we hope you find this module helpful.
Slide 2: Instructor

Bob McQueen, CEng, MICE
CEO
Bob McQueen and Associates Inc.
Orlando, FL, USA
Slide 3: Learning Objectives
- Understand the basic terminology of electronic payment systems applications and pricing strategies
- Describe electronic payment technologies, applications, and strategies
- Understand the application of electronic payment systems applications to transportation and Intelligent Transportation Systems and describe some challenges
- Understand the approximate costs and benefits associated with electronic payment systems applications and pricing
- Define the role of the private sector in electronic payment systems applications
- Describe some implementation examples and lessons learned
Author Notes for Slide 3:
Summary of learning objectives:
Review these with course participants to ensure clear common understanding of the module objectives
Note that this is not a "how to" course, but an awareness building and introductory course
Slide 4: Electronic Payment Systems Introduction
- Technologies - the technologies and products that can be applied to our needs, issues, problems and objectives. For example, contactless payment technologies
- Applications - specific technology implementations designed to address a set of needs, for example, an electronic toll collection system
- Strategies - ways in which the technologies can be applied to achieve specific policy objectives, for example, congestion pricing
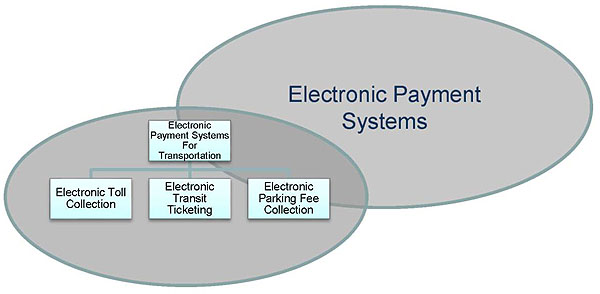
(Extended Text Description: This diagram demonstrates aspects of electronic payment systems. There are two large overlapping ovals. The top oval (upper right side) is labeled Electronic Payment Systems. The lower oval (lower left side) has four sub-boxes, starting with Electronic Payment Systems for Transportation at the top, with lines leading down to the three lower boxes: Electronic Toll Collection, Electronic Transit Ticketing, and Electronic Parking Fee Collection.)
Author Notes for Slide 4:
Point out the difference between technologies, applications, and strategies
Explain that transportation payment systems fit into a bigger picture of payments systems for general purposes
Note that there are three primary transportation electronic payment applications— electronic toll collection, electronic transit ticketing, and electronic parking fee collection.
There are also regional multimodal transportation payment systems. Each of these applications is covered in this module.
Slide 5: SFPark San Francisco
- The following link points to a video that provides an example of a smart car parking system being implemented in San Francisco
- This shows how electronic payment systems can be applied to fee collection for parking within a wider congestion management context
https://www.sfmta.com/demand-responsive-parking-pricing
Author Notes for Slide 5:
This video provides information on the effects and goals of the SFPark project.
It illustrates electronic fee collection for car parking, variable fees, and fits within a regional multimodal payment system.
Slide 6: Non-cash Transactions Worldwide
- 260 billion on-cash transactions worldwide
- Electronic payment techniques are growing in importance every year
- The USA accounts for more than 40% of the total, with 104 billion transactions
- Transportation electronic payment systems fit within this larger context and benefit from innovation and development from the wider market
Author Notes for Slide 6:
Highlights the growing importance of electronic payment.
Emphasizes the importance of the non-transportation payment context for innovation and development.
Slide 7: Contactless Payment Systems
- Short-range wireless technologies are used to enable payment without contact between the payment device and the reader
- This example shows a contactless smart card being used to pay for a transit fare in Finland
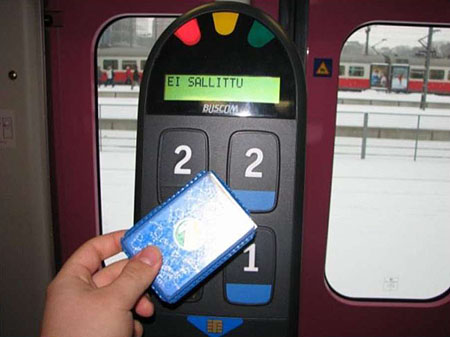
(Extended Text Description: This photograph depicts a transit payment device from Finland using a contactless smart card. The device is located on a train in front of a set of train doors (a snowy railway scene with a train is in the background). The device has large sensors labeled 2, 2, 1, (last one blocked), a digital screen above the buttons ("EI SALLITTU") and three colored lights in its rounded top (red (lit), yellow, green). A person is holding a blue plastic card up in front of the transit payment device.)
Author Notes for Slide 7:
Note the use of contactless technologies enables faster transit vehicle boarding and makes the system more reliable.
Image Source: Contactless Smartcard use for Transit in Finland. Retrieved from: https://en.wikipedia.Org/wiki/File:Matkakortti ja kortinlukija.jpg on January 31 2013
Slide 8: Near Field Communications
- The use of cell phones and smart phones to support contactless payment is known as Near Field Communications (NFC)
- This differentiates between this use and the use of the phone as a wide area wireless device for voice and data communications
- It also covers communications between one phone and another one
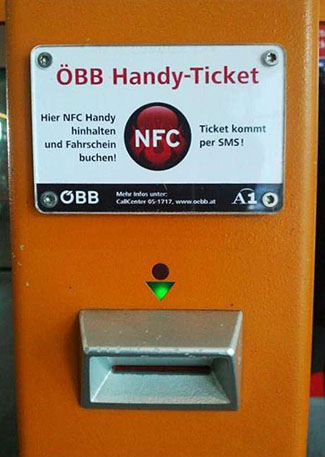
(Extended Text Description: This photograph depicts a transit ticketing device from Austria. It is a large orange metal box, with a sign bolted to the front that reads "OBB Handy-Ticket / Hier NFC Handy hinhalten und Farhschein buchen! / Ticket kommt per SMS!" with a circular red NFC logo in the center. Below is a circular light (unlit), a triangular green light (lit), and a metal card slot at the bottom.)
Author Notes for Slide 8:
The Near Field Communications (NFC) standards include ISO/IEC 18092 and those defined by the NFC Forum, which was founded in 2004 by Nokia, Philips and Sony, and now has more than 160 members.
The Forum also promotes NFC and certifies device compliance.
This technology will also be used to purchase items in department stores and for other non-transportation applications.
Image Source: Use of NFC for Transit Ticketing in Austria. Retrieved from: https://en.wikipedia.orq/wiki/File:NFCFahrscheinentwerter.ipq, on January 31, 2013
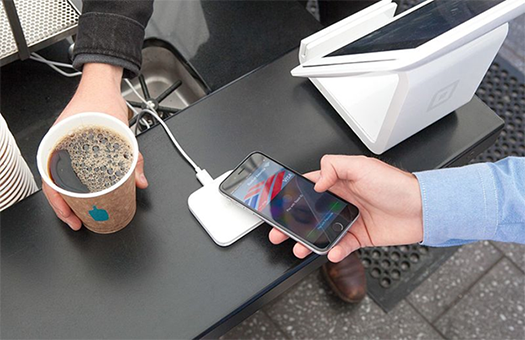
Slide 9: Android Pay and Apple Pay
- Use Near Field Communications technology
- Enables you to use your credit cards, store credit cards, and rewards cards with your smartphone or smart watch
- Apple Pay works with the cards you already have on the devices you use every day.
- Card details are never shared and aren’t stored on your device at all.
- Both let you use smartphones or smart watches to pay in over a million stores accepting contactless payments. You can also make purchases within participating apps.
Source: https://commons.wikimedia.org/wiki/File:Apple-payment-square.jpg
Author Notes for Slide 9:
To account for the launch of Android Pay and Apple Pay since the module was originally created, I have inserted slides 9 and 10 which explain the smart phone applications. Slide 9 provides an overview
Slide 10: Android Pay and Apple Pay Operation
- Android Pay was introduced in 2015 and Apple Pay was introduced in 2014. Both make use of Near Field Communications combined with Host Card Emulation (HCE)
- As the name suggests Host Card Emulation enables a smart phone to emulate a credit card and communicate with an appropriate Near Field Communication reader
- The user enters credit card data into the smart phone where is stored securely. When the user pays for an item, the credit card data is encrypted or “tokenized”
- This generates a one-time use temporary credit card number that is used to pay, thus protecting the users real credit card number.
- The Android Pay approach makes use of a cloud-based store to retain these tokens, with a few tokens held securely on the smart phone to enable payment when there is no cell phone signal. The Apple Pay approach makes use of a special chip on board the phone to store the tokens.
- Similar electronic payment approaches are being introduced by a number of banks and also by Samsung, one of the major cell phone manufacturers.
Author Notes for Slide 10:
Slide 10 provides some details on the operation of the smart phone technologies.
Slide 11: Smart Phones and Bar Codes
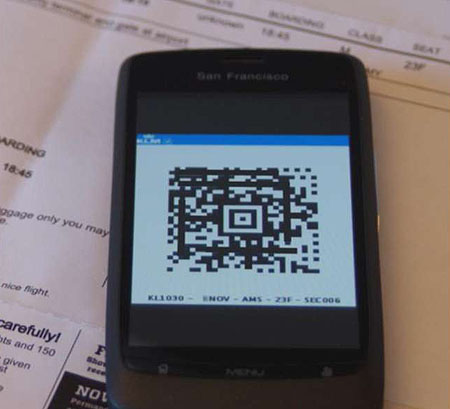
- Several major airlines are now using two-dimensional bar codes as a boarding pass
- You can download the bar code from the airline Web site and have it scanned by a special optical reader at TSA airport security
- The bar code is used as proof of payment
Author Notes for Slide 11:
Note that even paper boarding passes now have bar codes to enable machine scanning at electronic airport kiosks.
The mobile boarding pass technology is part of the International Airline Transport Association (IATA) Bar Coded Boarding Passes (BCBP) initiative.
At least 30 airlines use mobile BCBP. It is anticipated that at least 12% of airline passengers will use mobile BCBP in 2013.
Image Source: Samsung Focus Smartphone, retrieved from https://upload.wikimedia.org/wikipedia/commons/5/5f/Mobile_boarding_pass_KLM.JPG on January 31, 2013.
Slide 12: Bar Code Billboards
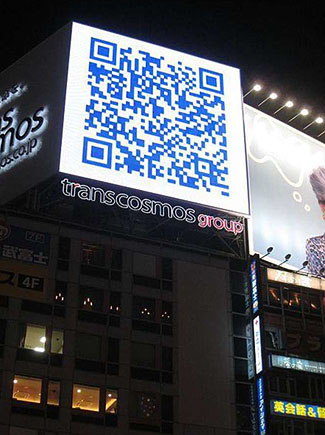
- Large bar codes can be used to transmit a lot of information to passersby
- Scan the bar code with your smart phone loaded with a special app and you can be taken to an appropriate Web site for more information
Author Notes for Slide 12:
Note that the three dimensional bar code is often referred to as a "QR" or Quick Response code.
Image Source: Japan QR Code Billboard, retrieved from https://commons.wikimedia.org/wiki/File:Japan-qr-code-billboard.jpg
Slide 13: Electronic Toll Collection
- Vehicle enters the toll zone and breaks the first laser beam (1), triggers transceiver (2)
- Transceiver signals vehicle's transponder/tag requesting time, date, and transponder, or tag identity
- Camera (3) photographs the vehicle's front license plate
- Vehicle breaks second laser beam (4) triggering the second camera (5)
- Second camera photographs the rear license plate
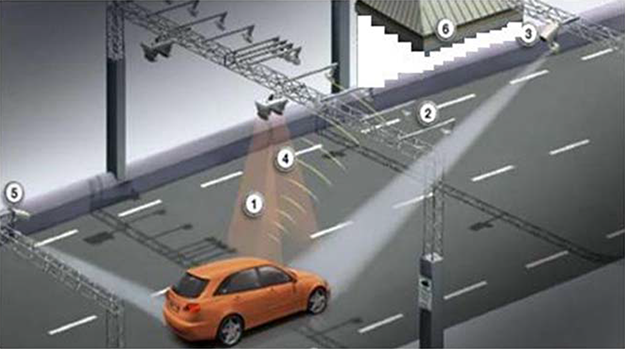
(Extended Text Description: This is a graphical illustration depicting electronic toll collection. There is a compact car on a two lane highway passing under the second of three overhead metal beams constructed over the highway. There are a series of lights and cameras and laser devices attached to the overhead beams. The illustration shows a white-shaded cone from the first overhead beam (under which the car has already passed) from the area of a camera on the beam to the car’s back license plate. The illustration shows two orange-shaded cones from two laser devices overhead on the second beam down to the car’s hood as the car is just beginning to pass under the second beam. There is another white-shaded cone from the third beam (under which the car has not yet passed) from a camera on the overhead beam to the front of the car. There is a building off the far side of the freeway with a 7-Eleven sign and striped paint.)
Author Notes for Slide 13:
Note that this is how it is done in Stockholm:
As the vehicle enters the toll zone it breaks the first laser beam (1) which triggers the transceiver (2) to wake up.
The transceiver then signals the vehicle's onboard transponder or tag requesting transmission of the time date and transponder or tag identity.
At the same time as the transceiver operates, the camera (3) photographs the vehicle's front license plate.
As the vehicle progresses through the tolling zone it breaks the second laser beam (4) triggering the second camera (5).
The second camera photographs the rear license plate.
Funds can be placed in the account via a website, at a bank, or at a retailer (6) such as a convenience store chain.
This provides an illustration of the process flow only and is not intended to be a detailed design.
Image Source: ETC concept from Stockholm Congestion Charging project. Based on information retrieved from: https://transportationfortomorrow.com/pdfs/commission_meetings/1006_meeting_washington/lamba_presentation_1006_meeting.pdf on June 5, 2013- content is no longer available.
Slide 14: Audience Interaction
- What is your opinion regarding open road tolling compared to all electronic toll collection?
- Should drivers be forced to use electronic means only, or should we always leave the opportunity to pay for cash at the roadside?
- Do the customer service benefits of accepting cash out weigh the cost of the cash collection?
Author Notes for Slide 14:
Take this opportunity to engage the audience for a few minutes and ask them for their thoughts and views.
Slide 15: Electronic Toll Process
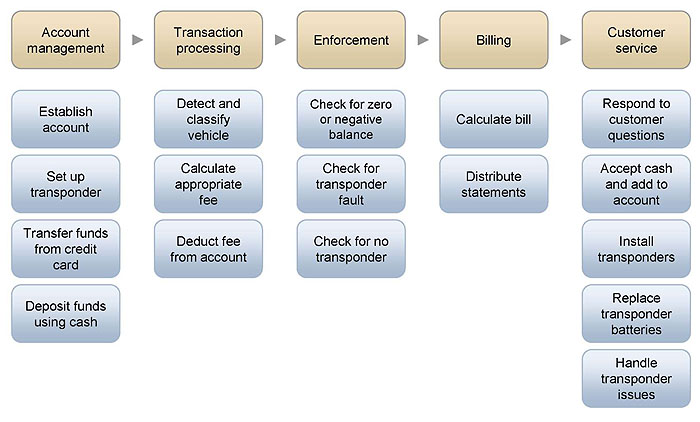
(Extended Text Description: This text-box diagram depicts the electronic toll process. There are a series of five columns with a brown text box at the top of each column, and then various numbers of blue text boxes underneath. The first column text box (left) is labeled "Account Management" with a triangular arrow pointing to the second column. Under "Account Management" are the boxes (top to bottom): Establish account, Set up transponder, Transfer fund from credit card, and Deposit funds using cash. The second column text-box is labeled "Transaction processing" with an arrow pointing to the third column. Under "Transaction processing" are the text boxes: Detect and classify vehicle, Calculate appropriate fee, and Deduct fee from account. The third column text-box is labeled "Enforcement" with an arrow pointing to the next column. Under "Enforcement" are the text boxes: Check for zero or negative balance, Check for transponder fault, and Check for no transponder. The fourth column text-box is labeled "Billing" with an arrow pointing to the final column. Under "Billing" are the text boxes: Calculate bill, and Distribute statements. The final column is labeled "Customer service" with the text-boxes underneath: Respond to customer questions, Accept cash and add to account, Install transponders, Replace transponder batteries, and Handle transponder issues.)
Author Notes for Slide 15:
This is a process diagram that captures the steps in an electronic toll transaction from the back office perspective.
The gold boxes at the top are milestones or major processes.
The blue boxes under each gold box break the major process down into smaller steps.
The objective is to illustrate that much of the work and resources are required behind the scenes in the back office.
Slide 16: Pricing Strategies
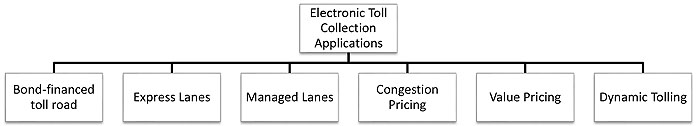
(Extended Text Description: This is a flowchart to show pricing strategies for electronic toll collection. The top text-box is labeled "Electronic Toll Collection Applications" and has lines leading to each of the following (left to right): Bond-financed Toll Road, Express Lanes, Managed Lanes, Congestion Pricing, Value Pricing, and Dynamic Tolling.)
- Now that we have electronic toll collection technologies at our disposal, there are a number of smart strategies that can be applied
- In ITS generally, there seems to be a change in emphasis from installing devices to discovering what management solutions we can apply
Author Notes for Slide 16:
Bond-financed toll roads: These are either publicly or privately owned and operated highway facilities. The money to plan, design, build, and operate such roads is raised from the private sector on the commercial bond market. This type of approach places an emphasis on maximizing throughput and revenue while delivering the highest possible levels of safety, efficiency, and customer service.
Express Lanes: The express lanes term is reserved for those lanes where the user pays a variable or fixed toll in return for use of a special purpose facility that typically operates in parallel with general purpose lanes that are not tolled, offering the driver a choice to pay or not.
Managed Lanes: A highway lane or set of lanes, or a highway facility, for which variable operational strategies such as direction of travel, tolling, pricing, and/or vehicle type or occupancy requirements are implemented and managed in real-time in response to changing conditions. Managed lanes are typically buffer or barrier-separated lanes parallel to the general-purpose lanes of a highway in which access is restricted to designated locations. There are also some highways on which all lanes are managed.
Congestion Pricing: Managing the demand for travel by varying the cost of travel by imposing a fee.
Value Pricing: An operating strategy in which the price to use the facility is varied according the value being delivered. The value can be defined in terms of trip time, average speed or trip time reliability. This can be achieved through the use of time of day pricing according to a pre-published schedule, or by adjusting the toll rates in near real time using dynamic tolling techniques.
Dynamic Tolling: The variation of toll rates for each time period and each road segment to achieve pre-defined service level objectives. Sensor data is used to calculate new toll rates at regular intervals and these are communicate to drivers using dynamic message signs.
Note that there is some confusion in the industry - express lanes and managed lanes are often used interchangeably.
Slide 17: Basic Economic Principles of Pricing
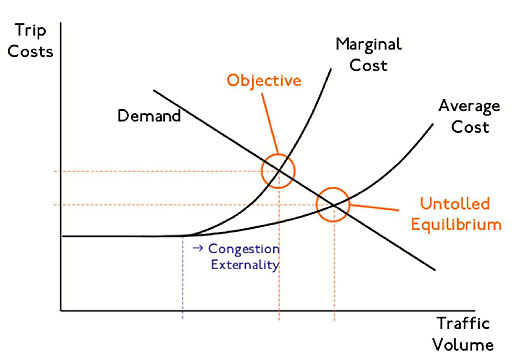
(Extended Text Description: This is a line graph depicting the basic economic principles of pricing. The x-axis is Traffic Volume and the y-axis is Trip Costs. Demand is shown as a descending diagonal straight line (moving upper left down toward lower right). Marginal cost is shown as a line that starts horizontal (about 1/4th of the way up the y-axis) and then curves steeply upward. The intersection between the Demand line and the curving Marginal Cost line is circled and labeled in orange as "Objective." The Average Cost line is shown as a line exactly overlapping the Marginal Cost line until the point of upward curve - the Average Cost line does not curve as steeply up as the Marginal Cost line. The intersection between the Demand line and the Average Cost line (which occurs more to the right and slightly lower than the Marginal Cost intersection) is circled and labeled in orange as "Untolled Equilibrium." Under the initial point of curving of the Marginal and Average Costs lines is a small arrow pointing to the right labeled "Congestion Externality.")
Author Notes for Slide 17:
The principle is very simple: the volume or the demand for travel is reduced as the cost of the trip is increased.
For example, in the figure, as trip cost is increased from average cost to marginal cost by imposing a toll or user fee, then traffic volume drops from the un-tolled equilibrium to the objective traffic volume.
The relationship between volume and price with respect to pricing and tolling for congestion is referred to as elasticity.
In economic terms, elasticity is defined as change in demand or volume divided by the change in price. Elasticity can also be defined as the slope of the straight-line shown in the diagram above.
History: In 1920, a British economist by the name of Arthur Pigou described the use of congestion pricing for a congested highway.
He was, in fact, trying to illuminate how social welfare would operate and was merely using a congested road as an example or analogy.
The true father of congestion pricing theory is probably the Economics Nobel Prize Winner, William Vickrey.
He was the first to propose a system of electronic tolling for congestion pricing purposes. He described a process where each car in the Washington metropolitan area would be equipped with a suitable transponder or tag.
Image Source: TE-Pricing-Equilibrium Congestion, retrieved from https://en.wikipedia.org/wiki/File:TE-Pricing-EquilibriumCongestion.png on May 21, 2013
Slide 18: Pricing Economics Simulator (1/3)
| Parameter |
1 |
2 |
3 |
4 |
5 |
| Scenario |
Description |
elasticity
(veh/hr/$) |
initial toll ($) |
initial traffic volume
(veh/hr) |
target traffic volume
(veh/hr) |
target toll ($) |
| 1 |
base case |
300 |
1 |
5000 |
2000 |
$11.00 |
| 2 |
change in elasticity |
601 |
1 |
5000 |
2000 |
$5.99 |
| 3 |
change in target traffic |
300 |
1 |
5000 |
3801 |
$3.00 |
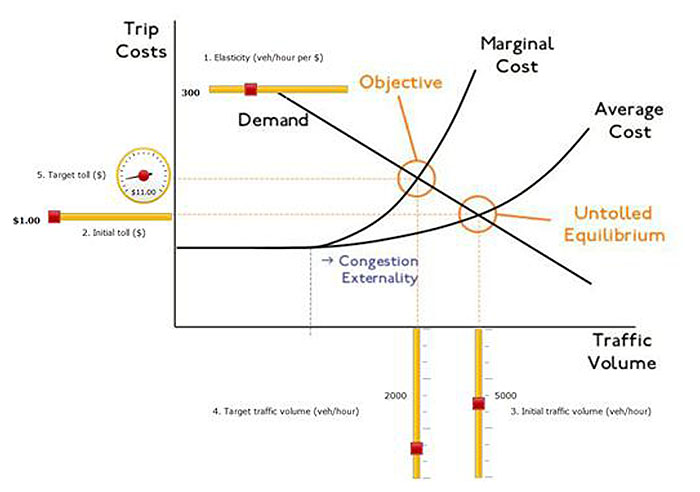
(Extended Text Description: The following descriptive notes are from the author. Please also see the Author Notes at the bottom of this Slide for additional relevant information for this slide. This Slide originally referred to a flash animation, but the author has broken down the concept into three still shots of the flash animation and provided the additional explanations below. This is the first of the three images intended to convey the message of this slide:
The variable tolling simulator is designed to illustrate how road pricing principles work. The graphic shows the relationship between the cost of making a trip and the demand for making the trip (traffic volume). The main principle is quite simple - if the trip costs more money, then less people will make it and traffic volume will be reduced. There are five main parameters associated with the graphic. These are: 1. Elasticity - this defines the relationship between cost of travel and demand for travel. For the purposes of this simulator elasticity is defined as vehicles per hour per dollar. In other words it specifies how many vehicles per hour will be deflected from making the trip for every dollar increase in the cost of making the trip. 2. Initial toll - even if there was no toll on the road there would be some cost associated with travel in terms of vehicle operating costs. Therefore we have set the initial toll at one dollar on all scenarios. 3. Initial traffic volume - measured in vehicles per hour. This is a measure of the demand for travel before pricing is introduced. 4. Target traffic volume - measured in vehicles per hour. This defines the target demand for travel after the price has been introduced. 5. Target toll - measured in dollars. This is the toll or price that would have to be imposed in order to achieve the target demand for travel or target traffic volume as specified in 4. Now let us consider the base scenario as illustrated in the figure. Each of the four parameters have been set at the following values, using the orange sliders: 1. Elasticity - 300 vehicles per hour per $ 2. Initial toll - $1.00 3. Initial traffic volume - 5,000 vehicles per hour 4. Target traffic volume - 2000 vehicles per hour as indicated on the target toll gauge (5), a price or toll of $11 would have to be imposed in order to achieve the target traffic volume.)
Slide 19: Pricing Economics Simulator (2/3)
| Parameter |
1 |
2 |
3 |
4 |
5 |
| Scenario |
Description |
elasticity
(veh/hr/$) |
initial toll ($) |
initial traffic volume
(veh/hr) |
target traffic volume
(veh/hr) |
target toll ($) |
| 1 |
base case |
300 |
1 |
5000 |
2000 |
$11.00 |
| 2 |
change in elasticity |
601 |
1 |
5000 |
2000 |
$5.99 |
| 3 |
change in target traffic |
300 |
1 |
5000 |
3801 |
$3.00 |
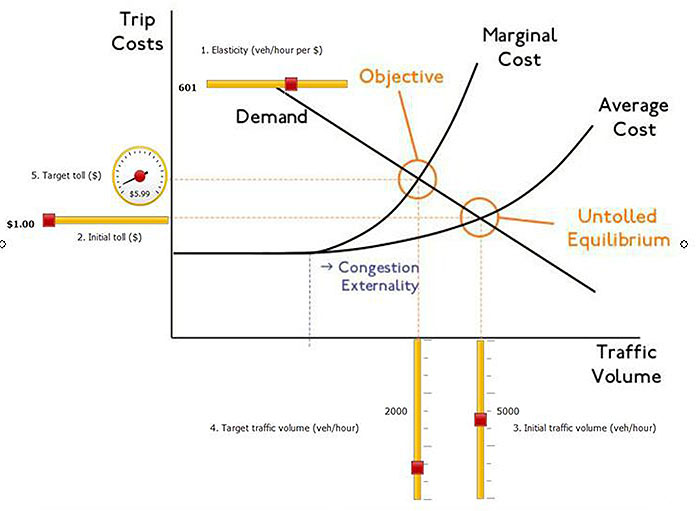
(Extended Text Description: The following descriptive notes are from the author. Please also see the Author Notes at the bottom of this Slide for additional relevant information for this slide. This Slide originally referred to a flash animation, but the author has broken down the concept into three still shots of the flash animation and provided the additional explanations below. This is the second of the three images intended to convey the message of this slide:
In this scenario the elasticity has been increased from 300 to 601, while all the other parameters remain the same. You can see that this has the effect of reducing the toll or price to be imposed from $11 to $5.99, since more vehicles will be deflected for every dollar increase in price.)
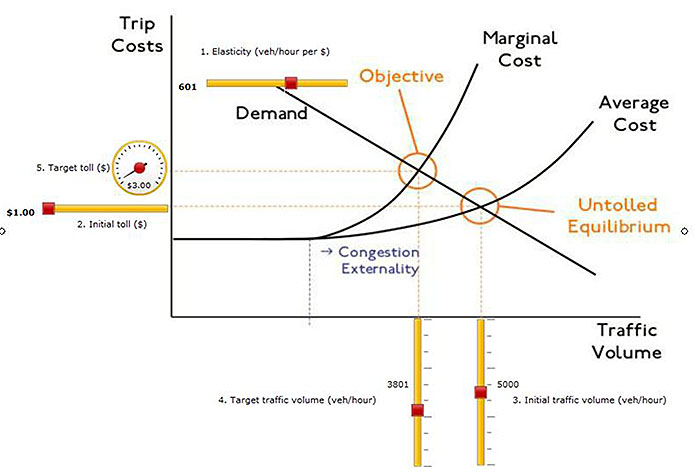
Slide 20: Pricing Economics Simulator (3/3)
| Parameter |
1 |
2 |
3 |
4 |
5 |
| Scenario |
Description |
elasticity
(veh/hr/$) |
initial toll ($) |
initial traffic volume
(veh/hr) |
target traffic volume
(veh/hr) |
target toll ($) |
| 1 |
base case |
300 |
1 |
5000 |
2000 |
$11.00 |
| 2 |
change in elasticity |
601 |
1 |
5000 |
2000 |
$5.99 |
| 3 |
change in target traffic |
300 |
1 |
5000 |
3801 |
$3.00 |
(Extended Text Description: The following descriptive notes are from the author. Please also see the Author Notes at the bottom of this Slide for additional relevant information for this slide. This Slide originally referred to a flash animation, but the author has broken down the concept into three still shots of the flash animation and provided the additional explanations below. This is the third of the three images intended to convey the message of this slide:
In this last scenario, the target traffic volume has been increased from 2000 vehicles per hour to 3801 vehicles per hour. Since we require to deflect less vehicles the target toll is now reduced to $3.00. Note that the elasticity has been held at 601 as in the previous scenario, so this one shows the combined effects of increasing both the elasticity and the target traffic volume compared to the base scenario.)
Author Notes:
Note that the animation may not be visible in Normal view and you may have to switch to Slide Show view to make it visible.
Use this Flash animation simulator to illustrate how demand changes with price along the elasticity curve.
Slider 1 allows you to set the elasticity as veh/hour per dollar Slider 2 allows you to set the cost of travel before tolling is applied Slider 3 allows the initial traffic volume to be set Slider 4 allows the target traffic volume to be set
Suggested demonstration approach
- Set the elasticity to 401 veh/hr per dollar
- Set the initial toll to $3.10
- Set the initial traffic volume to 5000 vehicles per hour
- Set the target traffic volume to 3001 vehicles per hour
- The gauge (5) should indicate a target toll of $8.09
Now move the various sliders to see the effects. For example, reducing the target traffic volume and keeping everything else the same should result in a higher target toll as more traffic needs to be diverted with a higher toll. Changing the elasticity and keeping everything else the same should have a proportionate effect on the target toll too.
Slide 21: Worldwide Pricing Projects
- There are almost 50 projects worldwide involving some form of pricing strategy.
- These projects represent a combination of toll roads, urban congestion pricing, value pricing, managed lanes, and express lanes strategy implementations.
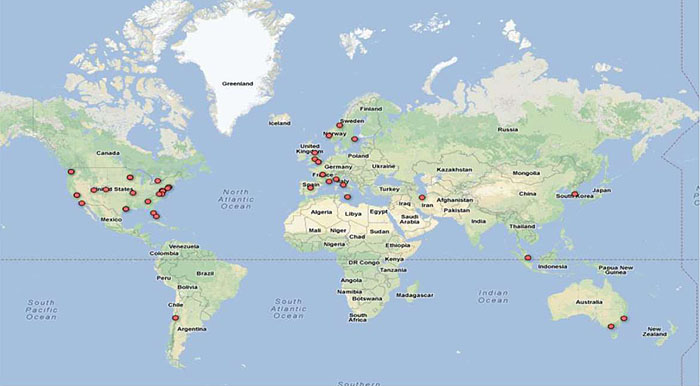
(Extended Text Description: The following descriptive notes are from the author. Please also see the Author Notes below for additional relevant information for this slide. This figure is for general illustrative purposes only. This is a world map depicting worldwide pricing projects. There are a series of approximately 34 red dots placed approximately in the following locations: United States/North America - Seattle, San Francisco, Los Angeles, Salt Lake City, Denver, Minneapolis, St. Louis, Houston, Atlanta, Toronto and many along the Eastern Seaboard; South America - Chile; Europe - Spain, United Kingdom, France, Norway, Sweden, Italy; Middle East/Asia: Iran, Indonesia, South Korea, Australia. This map depicts the almost 50 projects worldwide that involve some form of pricing strategy. Note that there are not fifty dots on the map as some cities have more than one project. The map shows that interest in the application of pricing is spread widely across the globe, indicating that the use of pricing strategies has become a mature activity.)
Author Notes for Slide 21:
Note that there are not 50 dots on the map as some cities have more than one project.
Interest in the application of pricing is global but implementation strategies vary considerably.
Slide 22: Dynamic Tolling Projects in the USA
- There are 11 projects that are conducting dynamic tolling currently in the U.S.
- Dynamic tolling can be viewed as a subset of managed lanes or express lanes as they are operated under variable tolling regimes in order to achieve a specific traffic conditions objectives.
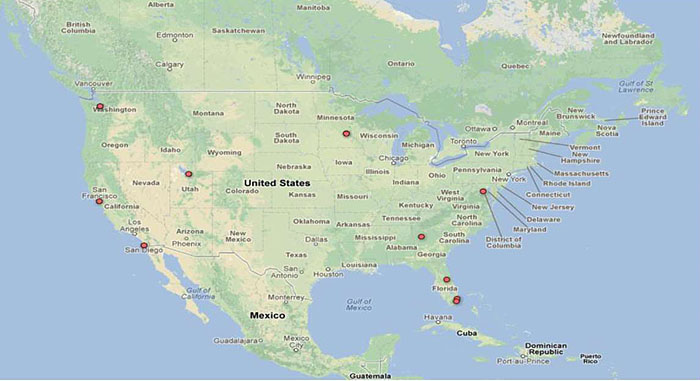
(Extended Text Description: The following descriptive notes are from the author. Please also see the Author Notes below for additional relevant information for this slide. This figure is for general illustrative purposes only. This is a map of the United States/North America depicting dynamic tolling projects in the USA. There are approximately 10 red dots in the following locations: Seattle, San Francisco, San Diego, Salt Lake City, Minneapolis, Atlanta, Orlando, Miami, DC. This map depicts the 11 projects within the USA that are currently using dynamic tolling techniques. Note that some cities have more than one project so there are not 11 dots. Dynamic tolling can be considered as one form of pricing technique. The map clearly shows widespread application of dynamic tolling techniques in US cities.)
Slide 23: Is It Variable or Dynamic Tolling?
| Variable tolling |
Pre-published schedules |
| For each segment |
| Vehicle classification |
| Time of day |
| Day of week |
| Dynamic tolling |
For each segment |
| Level of service based |
| Value of time saved based |
| Combination of level of service and value of time |
Author Notes for Slide 23:
As noted in the table, variable tolling techniques can simply involve the use of a pre-published table of toll rates updated at 3 to 6 month intervals based on traffic counts.
When a pricing schedule approach is adopted, the tolling is not really conducted in a truly dynamic fashion. A schedule of rates for each vehicle type for each segment of highway is made available to drivers both on the Web and at the roadside.
Drivers are then empowered to make a decision to use the facility or not. You can think of the refresh rate (the rate at which the toll is updated) as 3 to 6 months for this type of project.
This approach takes advantage of the flexibility of electronic toll systems to make pricing changes rapidly and with minimum expense.
On the other hand, dynamic tolling makes use of sensors in the roadway that are used to continuously monitor traffic flow. Incremental adjustments of the toll are then made to correspond to changes in the traffic flow.
One approach to this is to install sensors in the express lanes and adjust the toll in order to preserve a specific level of service on those lanes.
Another approach involves the installation of sensors on both the express lanes and parallel general-purpose lanes.
Travel times on both facilities are then computed and the toll charged on the basis of the travel timesaving experienced by drivers on the express lanes.
Slide 24: Typical Dynamic Tolling Algorithm
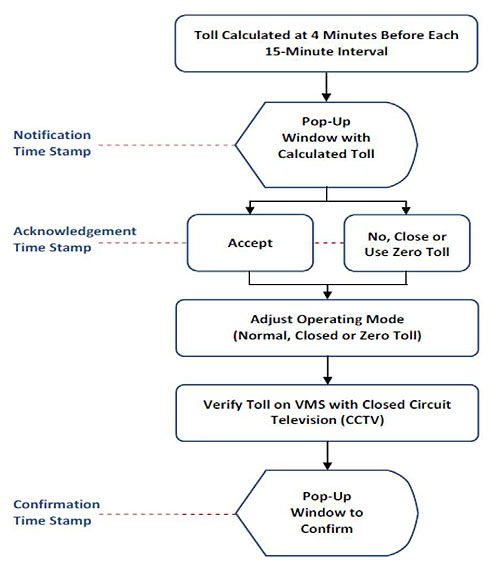
(Extended Text Description: This is a flowchart depicting the typical dynamic tolling algorithm. At the top is a text-box "Toll Calculated at 4 Minutes Before Each 15-Minute Interval" with an arrow pointing below to the second text-box "Pop-Up Window with Calculated Toll." There is a dotted line leading to the left to the words "Notification Time Stamp." The second text box has two arrows pointing to the two side-by-side text boxes below it: "Accept" (left) with a dotted line to the left with words "Acknowledgement Time Stamp" and "No, Close or Use Zero Toll" (right). There is a dotted line between these two text-boxes. They both have an arrow pointing to the lower text-box "Adjust Operating Mode (Normal, Closed or Zero Toll)" with an arrow pointing below to the next text-box "Verify Toll on VMS with Closed Circuit Television (CCTV)" with an arrow pointing down to final text-box at the bottom of the flowchart "Pop-Up Window to Confirm." There is a dotted line to the left with words "Confirmation Time Stamp.")
Source: 95 Express Toll Facilities Operations Manual, Florida Department of Transportation, Version 2.0, December 2008.
Author Notes for Slide 24:
For this implementation the toll is calculated at 15-minute intervals.
The toll calculation is initiated 4 minutes before each 15-minute interval begins to allow time for the new toll to be calculated, the operator to validate the new toll and for it to be communicated to drivers via dynamic message signs.
The system also has "closed" and "zero toll" modes.
These are used when an incident requires that express lanes be closed to traffic (close mode) or when an evacuation scenario requires the toll to be removed completely for a period of time to facilitate evacuation (zero toll mode).
Slide 25: Audience Interaction
- What is your opinion regarding urban congestion pricing?
- Would you be prepared to pay a mandatory fee for access to a downtown area in the U.S.?
- Do you think that pricing is fair?
Author Notes for Slide 25:
Take this opportunity to engage the audience for a few minutes and ask them for their thoughts and views.
Slide 26: Defining Strategic Objectives
- Congestion Reduction
- Peak Spreading
- Modal Shift
- Revenue Generation
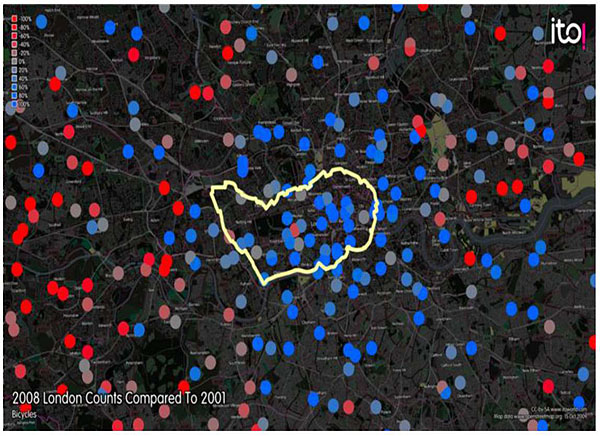
(Extended Text Description: The following descriptive notes are from the author. Please also see the Author Notes below for additional relevant information for this slide. This figure is for general illustrative purposes only. The image is a large aerial map (dark in color) showing lines for roadways around London. There are many dots covering the map, with a slight concentration at the center of the map. The center maps has mainly blue and light blue/gray dots. Farther to the outside of the map, there are more red and light pink/gray dots. There is a key scale in the upper left corner with a series of color boxes (dark red to light red/gray and light blue/gray to dark blue) with percentages listed beside each color block. There is a yellow irregular shaped outline overlaid the center area of the map. The London project also had modal shift effects as illustrated the figure, which illustrates an increase in the use of bicycles. The blue dots show an increase in the number of bicycles counted during traffic counting. The red dots show a decrease. The gray dots show no change. The figure clearly demonstrates that there was an increase in the use of bicycles within the congestion pricing zone (shown in yellow).)
Author Notes for Slide 26:
Both the London and Stockholm projects have the primary objective of congestion reduction. This was achieved by imposing a mandatory charge for travel into downtown congested areas during the daytime.
The objective is to deflect a proportion of the traffic to other modes of transportation or to travel at different times of the day.
The reduction congestion objective can also address emissions management objectives through modal shift and congestion reduction
The modal shift effects of the London congestion pricing project is shown in the figure.
The blue dots show an increase in the number of bicycles counted during traffic counting. The red dots show a decrease.
In some cases the objective is not to divert traffic away from the road, especially if it is a toll road, but to encourage drivers to advance or delay their trips to avoid the peak period.
This strategy is known as peak spreading as the intent is to spread the peak period traffic over a longer period by toll increases during the very peak period.
When the objective is to divert traffic to another mode of transportation such as transit, bicycle or pedestrian modes, then the strategy to be applied is known as modal shift.
This requires that viable alternative modes are available and that good traveler information can be delivered to make drivers aware of the choices.
The revenue generated from a pricing project can be reinvested into transportation infrastructure in the region.
It may also be used to accelerate the development and construction of infrastructure by funding availability payments or some other form of public private partnership.
Note that revenue generation as a strategy can be implemented in tandem with the other strategies above with the exception of modal shift.
Image Source: Changes in the counts of bicycles in London at October 2008 compared to October 2001. Retrieved from: https://en.wikipedia.org/wiki/File:London congestion cycles.png on January, 31 2013.
Slide 27: Multimodal Electronic Payment Systems
- Regional multimodal electronic payment system - all modes of transportation addressed by single payment system
- While there may be one single payment system there may be different payment devices
- For example, vehicle-based payment can be achieved by transponder or tag while personal based payments such as ticketing for transit systems can be accomplished with a smartcard
- The same account can be used for both even if different payment devices are used
- Regional multimodal approach offers more management solution possibilities
- For example, conditional discounts could be offered where users of the transit system on one particular day may be offered free parking downtown for another day when they decide to take their car
Author Notes for Slide 27:
Note that multi-application does not imply a single payment device.
The single account is often known as a "universal transportation account."
Slide 28: Challenges
- Requirements definition
- Proprietary technologies
- Funding and financing
- Future proofing
- Privacy and anonymity
- Fairness and equity
- Fitting within the wider context
- Harnessing regional partners
- Finding the best business model
Author Notes for Slide 28:
Proprietary technologies are attractive initially as they represent off-the-shelf solutions but can be a lock-in issue over time.
Funding and financing challenges must be addressed through clear communication of the value proposition and the services to be delivered by the project.
Future proofing is never guaranteed but we should look as far ahead as we can when planning these systems.
Privacy and anonymity can be traded for service and benefits under optional mechanisms.
Fairness and equitable treatment are key to public acceptance.
Getting the most out of regional investments in technology needs context.
Partners can share the cost of deployment and operations, avoiding duplicate investments.
The business model should match the capabilities and constraints of the technology chosen.
Slide 29: Electronic Payment, Transportation, ITS
- Electronic toll collection and pricing considered as a subset of ITS
- Many ITS applications complementary to electronic toll collection and pricing systems
- Electronic toll collection and pricing set within a wider context of performance management
- Electronic payment systems applications can be powerful collectors of data for performance management
- Electronic payment systems applications fit within ITS and transportation management through delivery of more efficient data collection and demand management
- The flexibility of electronic systems to adjust payment provides demand management possibilities
Author Notes for Slide 29:
Consider the case of a toll agency operating an express lanes facility in a major urban area.
One of the most important success factors in system operation lies in effective marketing to tell the drivers how to use the facility, how much it is going to cost them, and how they should go about preparing themselves to use the system.
In short, there is a need for traveler information.
Slide 30: The Role of the Private Sector
- Providing technology products and services
- The private sector may have already invested considerable sums in technologies, products and services that can be incorporated into a public agency project
- Providing expertise and experience
- Many private sector companies have the ability to conduct business worldwide and may have gathered expertise and experience that is difficult to accumulate in a local context
- Providing financing
- It may also be possible for the private sector to provide financing under a suitable public private partnership relationship
Author Notes for Slide 30:
The private sector may have already developed a number of technologies, products and services that are available off the shelf.
Adapting the design of the project to take advantage of these commercial off-the-shelf elements could have substantial cost reduction consequences.
It should also be recognized that commercial off-the-shelf products have been developed on the basis of an understanding of the business process for previous initiatives.
It may be valuable to consider the nature of these prior business processes before embarking on a complete redesign of the business process for your project.
In some cases the private sector has particular expertise and experience not found in public sector organizations. This is especially true when private sector resources are drawn from areas beyond transportation.
A private sector organization may also have had the opportunity to gain experience over a number of regions and a number of projects.
This experience would be very complementary to the public sector agency experience which goes into great detail in one single region.
The specialist resources could be particularly important in both the planning and design stages of project. In many cases, private sector organizations also have specialist expertise in operations, maintenance and management.
In addition to providing expertise the private sector may also be able to deliver the resources required to help plan, design, build, operate, maintain, and manage the project.
Not every public agency has the in-depth operational experience or expertise required to successfully execute an Electronic payment systems payment project.
In today's economic conditions the public sector may not always have the resources required to fund the project.
It may be possible that the private sector could provide finance for the project if a suitable compensation mechanism can be defined.
Electronic payment systems are particularly suitable for this approach because they have an inherent charging mechanism.
For example a transaction fee could be applied to every transaction to compensate the private sector for financing resources invested in the project.
Experience has shown that this approach requires careful structuring of the business model and contractual agreements.
Slide 31: Illustrative Examples
|
Name of Project |
Description |
Web Link |
| 1 |
ORCA Card |
Implemented a single smart card for bus, rail, and ferry services in the Seattle Metro area. Single card, multiple modes, multiple service providers |
www.myorca.com |
| 2 |
New Jersey Transit Google Wallet trial |
Trial of smartphone technology to pay for transit fares in New Jersey with Google Wallet |
Content is no longer available. |
| 3 |
New York and New Jersey NFC payment trial |
Trial involving MasterCard and Visa on the use of smartphones with NFC technology for transit fare payment |
Content is no longer available. |
| 4 |
Houston Katy Freeway Express Lanes |
Dynamic tolling on express lanes retrofitted in the median of major freeway |
https://www.hctra.org/KatyManagedLanes |
| 5 |
WMATA Washington DC-SmarTrip |
Smart card system for paying bus and Metro fares in Washington DC |
https://www.wmata.com/fares/smartrip/ |
| 6 |
CTA Chicago Card |
Smart card system for paying bus and Metro fares across multiple operators in the Chicago Metropolitan Area |
Content is no longer available. |
| 7 |
I15 FasTrak Tolls San Diego |
First implementation of dynamic tolling on express lanes in the USA |
https://www.sandag.org/uploads/publicationid/publicationid_6_1065.pdf |
| 8 |
EZPass Group |
Coalition of agencies in the northeast sharing interoperable electronic toll collection system and central clearing/settlement |
https://www.ezpassiag.com/aboutus/overview |
| 9 |
Oregon Mileage Based Road User Fees |
Pilot projects and legislation development to replace fuel based taxation with distance based |
Content is no longer available. |
Author Notes for Slide 31:
The above nine examples cover a range of transportation electronic payment applications.
Use the Web links provided to show further information on each project.
Slide 32: Lessons Learned
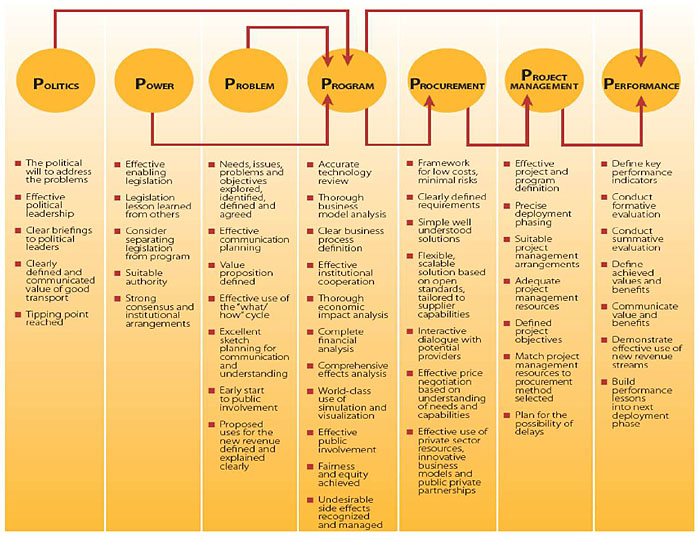
(Extended Text Description: This diagram shows the lessons learned from the London and Stockholm congestion charging projects. At the top of the diagram of a series of seven text ovals with a column of notes under each. The ovals have arrows pointing to various other ovals, showing a relationship between certain categories. From left to right: The first column has a text oval "Politics" with an arrow pointing to the middle text oval "Program." Under "Politics" are the following bullet points: The political will to address the problems; Effective political leadership; Clear briefings to political leaders; Tipping point reached. The second column is headed by the text oval "Power" which has an arrow pointing to the "Program" oval. Under "Power" are the following bullet points: Effective enabling legislation; Legislation lesson learned from others; Consider separating legislation from program; Suitable authority; Strong consensus and institutional arrangements. The third column is headed by the text oval "Problem" with an arrow pointing to the "Program" oval. Under "Problem" are the following bulleted points: Needs, issues, problems and objectives explored, identified, defined and agreed; Effective communication planning; Value proposition defined; Effective use of the "what/how" cycle; Excellent sketch planning for communication and understanding; Early start to public involvement; Proposed uses for the new revenue defined and explained clearly. The fourth (middle) column is headed by the "Program" oval. It has two arrows, one pointing to the "Procurement" oval and one to the "Performance" oval. Under "Program" are the following bullet points: Accurate technology review; Thorough business model analysis; Clear business process definition; Effective institutional cooperation; Thorough economic impact analysis; Complete financial analysis; Comprehensive effects analysis; World-class use of simulation and visualization; Effective public involvement; Fairness and equity achieved; Undesirable side effects recognized and managed. The fifth column is headed by the "Procurement" oval with an arrow pointing to the "Project Management" oval. Under "Procurement" are the following bullet points: Framework for low costs, minimal risks; Clearly defined requirements; Simple well understood solutions; Flexible scalable solution based on open standards, tailored to supplier capabilities; Interactive dialogue with potential providers; Effective price negotiation based on understanding of needs and capabilities; Effective use of private sector resources, innovative business models and public private partnerships. The sixth column is headed by the oval "Project Management" with an arrow pointing to "Performance." Under "Project Management" are the following bulleted points: Effective project and program definition; Precise deployment phasing; Suitable project management arrangement; Adequate project management resources; Defined project objectives; Match project management resources to procurement method selected; Plan for the possibility of delays. The final column is headed by the oval "Performance" with the following bullet points underneath: Define key performance indicators; Conduct formative evaluation; Conduct summative evaluation; Define achieved values and benefits; Communicate value and benefits; Demonstrate effective use of new revenue streams; Build performance lessons into next deployment phase.)
Author Notes for Slide 32:
Summary of lessons from the London and Stockholm congestion charging projects. These could be summarized as the 7 "Ps" to make them easier to remember.
Slide 33: The Cost of Change Lesson
- The lesson is simple - ambiguity costs money.
- Ambiguity appears in system requirements due to lack of formal agreement on what the system is designed to do and lack of definition on specific requirements.
- As a rule of thumb it will cost approximately $1,000 to correct problems during the deployment stage.
- While that same problem could have been dealt with during the requirements gathering stage for approximately $1.
- That is why it's worthwhile investing heavily in initial requirements analysis and objectives agreement.
Author Notes for Slide 33:
Boehm demonstrated through his study of a number of large-scale system development projects that failure to remove ambiguity will cost an increasing amount of resources through the different stages of the project.
As the figure clearly illustrates, the cost of ambiguity rises dramatically as the project progresses.
Slide 34: Typical Cost Elements
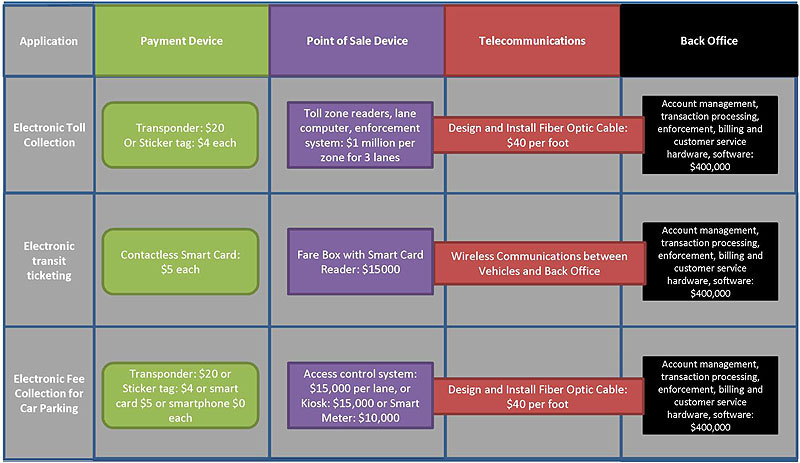
(Extended Text Description: This chart organizes the typical cost elements. The top row (left to right) reads "Application," "Payment Device" (green), "Point of Sale Device" (purple), "Telecommunications" (red), "Back Office" (black). The second row reads (left to right): "Electronic Toll Collection," "Transponder: $20 Or Sticker tag: $4 each" (green), "Toll zone readers, lane computer, enforcement system: $1 million per zone for 3 lanes" (purple), "Design and Install Fiber Optic Cable: $40 per foot" (red), "Account management, transaction processing, enforcement, billing and customer service hardware, software: $400,000" (black). The third row reads (left to right): "Electronic transit ticketing," "Contactless Smart Card: $5 each" (green), "Fare Box with Smart Card Reader: $15000" (purple), "Wireless Communications between Vehicles and Back Office" (red), "Account management, transaction processing, enforcement, billing and customer service hardware, software: $400,000" (black). The fourth row reads (left to right): "Electronic Fee Collection for Car Parking," "Transponder: $20 or Sticker tag: $4 or smart card $5 or smartphone $0 each" (green), "Access control system: $15,000 per lane, or Kiosk: $15,000 or Smart Meter: $10,000" (purple), "Design and Install Fiber Optic Cable: $40 per foot" (red), "Account management, transaction processing, enforcement, billing and customer service hardware, software: $400,000" (black).)
Author Notes for Slide 34:
These are estimated costs taken from the FHWA benefit cost database.
These are for determining the approximate scale of the project.
Actual project costs should be determined based on a detailed analysis of the specific implementation.
Slide 35: Summary
- Electronic payment systems for transportation fit within a wider context of payment systems
- Electronic payment systems are comprised of technologies
- Electronic payment systems solutions are applied to a number of application areas.
- Electronic toll collection
- Electronic transit ticketing
- Electronic fee collection for parking
- Multimodal electronic payment systems
- Electronic toll collection can be carried out in a number of ways.
- Open road tolling
- All electronic toll collection
- Dynamic tolling
- There are a number of pricing strategies that can be applied
- Bond financed toll roads.
- Express lanes.
- Managed lanes
- congestion pricing.
- Value pricing
- Dynamic tolling
- Pricing is based on a basic economic principles relating cost of travel to demand for travel
- There are multiple potential roles for the private sector in an electronic payment system
- Multiple lessons have been learned from prior implementations
- A significant body of knowledge has been developed for both benefits and costs
- Electronic payment systems have been proven to deliver value in terms of safety, efficiency, and customer service
Author Notes for Slide 35:
This Slide summarizes the key points of the presentation.
It should be used to set the scene for the subsequent slide, which poses a serious of questions to the students in order to gauge their understanding of the material.
Slide 36: References
The following additional resources can be used to gather more information and practical insight into electronic payment systems applications, electronic toll collection, and pricing:
Slide 37: Questions
- What is the difference between ORT and AETC?
- Describe one electronic payment technology, one application, and one strategy.
- What is the relationship between electronic payment systems and performance management?
- Name two challenges that could be faced implementing electronic transportation payment systems.
- Name one benefit of electronic payment systems applications and pricing.
- Define one role that the private sector might play in electronic payment systems.
- Describe two implementation examples and results achieved.
Author Notes for Slide 37:
Sample answers to questions:
- What is the difference between ORT and AETC? - Open Road Tolling (ORT) operation allows drivers to pay by cash at separate plaza facilities off to the side of the mainline. Under All Electronic Toll Collection (AETC) operation, the driver must pay electronically, either by transponder or video tolling.
- Describe one electronic payment technology, one application and one strategy - smart cards, transit ticketing, dynamic tolling.
- What is the relationship between electronic payment systems and performance management? -Electronic payment systems applications can be powerful collectors of data for performance management.
- Name two challenges that could be faced implementing electronic transportation payment systems - Two challenges are Privacy and anonymity and Fairness and equity.
- Name one benefit of electronic payment systems applications and pricing - reduced delay, reduced emissions, and improved customer service would all be correct answers.
- Define one role that the private sector might play in electronic payment systems - Providing Technology Products and Services, Providing Expertise, and Experience and Providing Finance would all be correct answers.
- Describe two implementation examples - Houston Katy Freeway Express Lanes (dynamic tolling on express lanes retrofitted in the median of major freeway), WMATA Washington DC -SmarTrip (smart card system for paying bus and Metro fares in Washington, DC).
Return to top ↑