← Back to Module 9
ITS ePrimer Presentation
Module 9: Supporting ITS Technologies
(Note: The following PowerPoint presentation is a supplement to the module.)
Slide 1: ITS ePrimer Module 9: Supporting ITS Technologies

September 2013
Intelligent Transportation Systems Joint Program Office Research and Innovative Technology Administration, USDOT
Author Notes for Slide 1:
This is the first, title slide in all modules.
The following slides are in this order:
- Instructor
- Learning Objectives
- Content-related slide(s)
- Summary (what we have learned)
- References
- Questions?
This module is sponsored by the U.S. Department of Transportation's ITS Professional Capacity Building (PCB) Program. The ITS PCB Program is part of the Research and Innovative Technology Administration's ITS Joint Program Office.
Thank you for participating and we hope you find this module helpful.
Slide 2: Instructor

Brody Hanson MScE, P.Eng.
Research Associate University of New Brunswick Fredericton, NB, Canada
Slide 3: Learning Objectives
- Understand the various physical components of an intelligent transportation system (ITS)
- Describe the different types of hardware technology used in each component
- Understand the strengths/limitations of comparable technologies
- Describe example applications of supporting technologies
Slide 4: Presentation Overview
- Vehicle Detection
- Vehicle Monitoring and Tracking
- Communications
- Central Hardware and Systems
- Dynamic Message Signs
- Video Cameras
- Road Weather Information Systems
- Connected Vehicle Technologies
- Summary
Author Notes for Slide 4:
- While other modules in this ePrimer focus on the application side of ITS, this module presents the actual equipment and technologies used to enable these applications.
- The module is broken down into sections that try to encapsulate and group the various physical components of an ITS so that the different types of technologies can be compared and understood.
Slide 5: Vehicle Detection
Point Detection
Intended to capture all vehicles moving through detection zone
- Inductive Loops
- Measure inductance changes caused by large metal surface areas
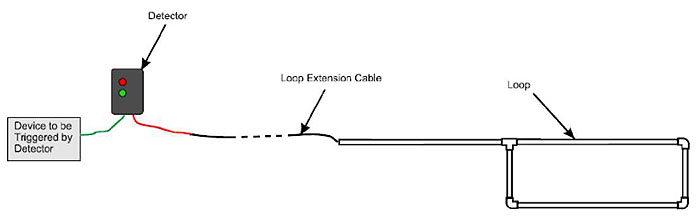
(Extended Text Description: This is a diagram of an inductive loop. Starting on the left, there is a gray box labeled "Device to be Triggered by Detector." A green line goes from this box, to a dark gray box labeled "Detector." There are two small indicators on the detector, one red and one green. From the detector, a red line comes out, and then joins with a black line. The black line goes from being solid to dashed, and back to solid. This is identified as a "Loop Extension Cable." The loop extension cable connects to a structure made up of five lines and four joints in the shape of a larger rectangle loop. This structure is initially straight, and is connected to a loop made up of the remaining four rectangles and joints. For additional relevant information about this diagram, please see the Author Notes below.)
Source: Doug Marsh/Marsh Products, Inc
Author Notes for Slide 5:
- Vehicle detection:
- Vehicle detection is a cornerstone of most transportation applications
- Most notably at signalized intersections to allow for traffic lights to change based on traffic demands rather than pre-timed intervals
- Point detection: Intended to capture all vehicles moving through detection zone
- How inductive loops work:
- Measure magnetic frequency
- When a large metal object (e.g., car) moves over loop the frequency increases
- Can provide volume, occupancy, speed, vehicle lengths
- Shortcomings of inductive loops:
- Intrusive technology; susceptible to damage; difficult to install/maintain in bridges
- Limited deployment distance from cabinet
- Must be calibrated properly; lane changing can cause multiple or missed detections
Slide 6: Vehicle Detection
Point Detection
- Radar
- Microwaves reflect off metal surfaces
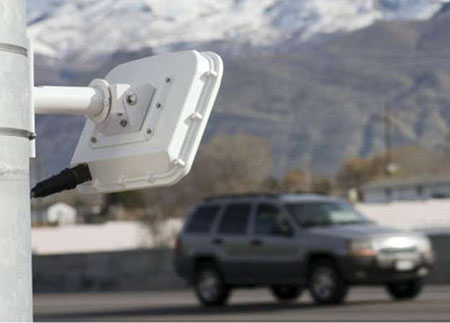
Source: Wavetronix
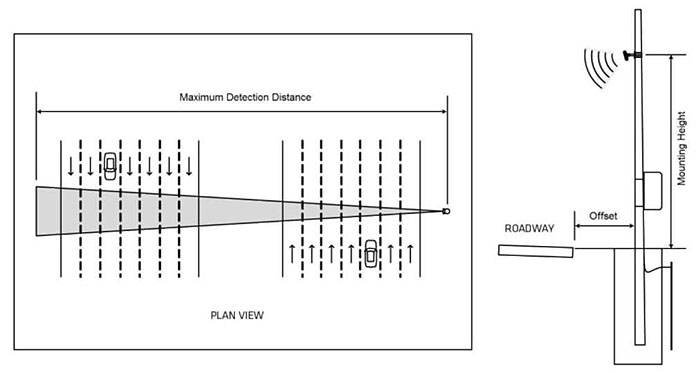
(Extended Text Description: This image contains two diagrams. The diagram on the left is a Plan View showing the Maximum Detection Distance for a radar device. In this diagram, there are two sets of drawings of a seven-lane roadway oriented vertically. The seven-lane road on the left has a drawing of a car, along with arrows in each lane pointing down. The seven-lane road on the right has a drawing of a car, along with arrows in each row pointing up. On the far right of the diagram, there is a small device. A triangular beam emanates from the device across all fourteen lanes of traffic. The distance from the small circle to the far end of the beam is labeled "Maximum Detection Distance." The diagram on the right illustrates the height and distance the radar device needs to be mounted from the road. Starting on the left, there is a horizontal rectangle labeled "Roadway." To the right of the roadway, is a horizontal line, level to the top of the rectangle, and extends beyond a long vertical pole. A radar device is drawn on the upper third of the pole with a wave signals drawing coming from the device. The pole extends below the surface level of the road. The distance from the roadway to the pole is labeled "offset." The distance from the surface level to the radar device is labeled "Mount Height.")
Source: Wavetronix
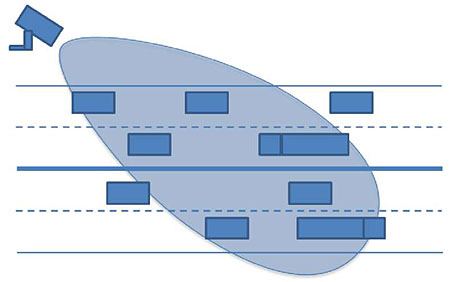
(Extended Text Description: This image represents the coverage area of a single radar device. In this image, there are rectangles representing vehicles in a drawing of a road with two lanes going in both directions. On the left there is a rectangular mounted device. From the device, a tear dropped oval is coming from the device and masks a portion of the roadway in blue. It does not cover all the cars depicted as driving on the road. )
Source: Brody Hanson Consulting
Author Notes for Slide 6:
- How radar works:
- Microwaves emanate from device
- Reflect off metal, reflections detected and provide position of vehicle relative to detector
- Can provide volume, occupancy, speed, vehicle lengths
- Side-fire configuration
- Front-fire configuration
- Shortcomings of radar:
- Reflections/interference from nonvehicle metallic objects
- Occlusion
- Mounting height/offset restrictions
- Wind/snow/rain decrease performance
Slide 7: Vehicle Detection
Point Detection
- Laser
- Overhead mounted laser devices
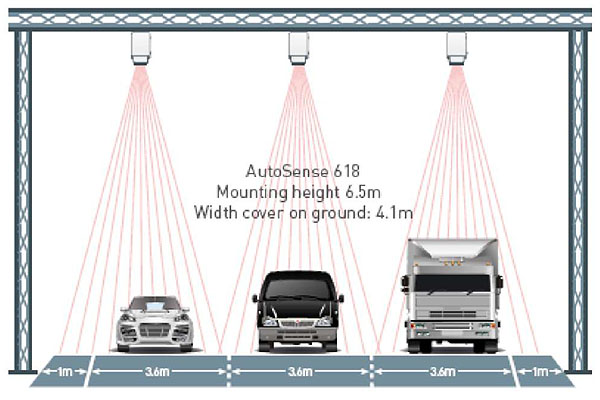
(Extended Text Description: This diagram shows icons of a sedan, a minivan, and a cargo truck side-by-side on three lanes of road underneath laser devices mounted overhead. There are three mounted devices, one to cover each lane. Laser beams depicted as a series of radiating lines shine down on each vehicle in a conical formation to cover to full width of each lane. Each lane of road is 3.6 meters with 1 meter of shoulder on both sides of the road. In the center of the model is the following text: "Autosense 618, Mounting Height 6.5 meters, Width cover on ground: 4.1 meters.")
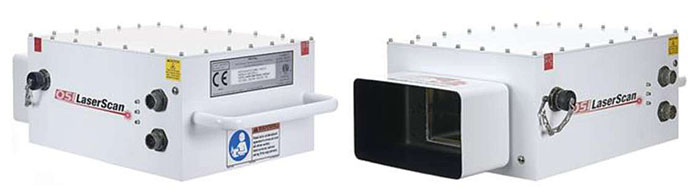
Source (both images): OSI LaserScan
Author Notes for Slide 7:
- How laser works:
- Lasers mounted overhead, point down at pavement
- Vehicles pass through laser beams, laser light is reflected and distance from unit is measured
- Can provide volume, occupancy, speed, vehicle lengths, vehicle profiles. Highly accurate.
- Shortcomings of laser detection:
- Snow/fog/rain can decrease performance
- Mounted overhead requiring additional infrastructure
Slide 8: Vehicle Detection
Point Detection
- Video Image Processing
- Images from a video camera sent through Video Image Processing unit
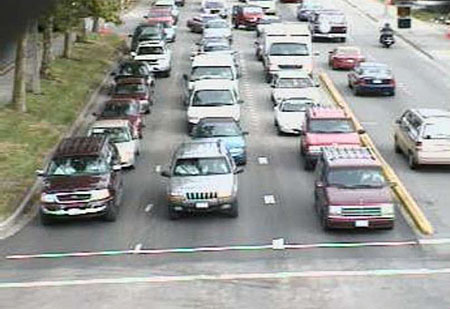
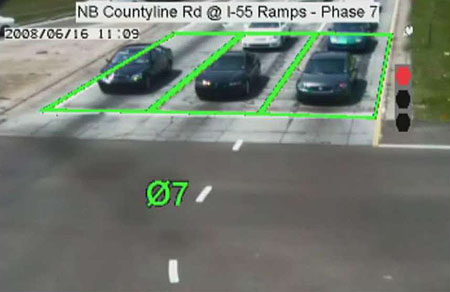
Source (both images): Econolite
Author Notes for Slide 8:
- How video works:
- Images from video camera sent through image processing unit
- Detection zones are created within the field of view
- Image processer compares "no vehicle" image of detection zones to current image by processing the pixel colors/changes
- Can provide volume, occupancy, speed, turning movement counts (in some applications)
- Shortcomings of video detection (headlight glaring, visibility, etc.)
- Thermal cameras is an emerging area. Measure heat/absence of heat in detection zone instead of comparing image pixels
Slide 9: Vehicle Detection
Point Detection
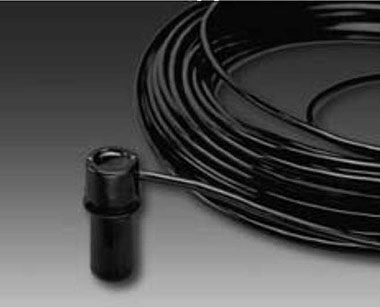
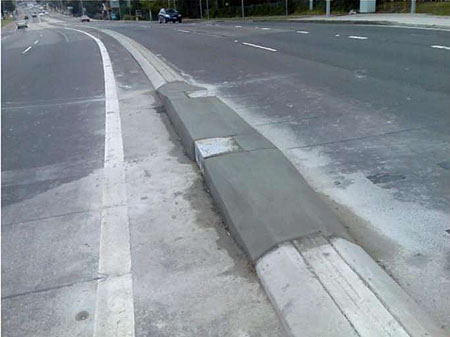
- Magnetometers
- Measure changes in the Earth's magnetic field
Source: Global Traffic Technologies
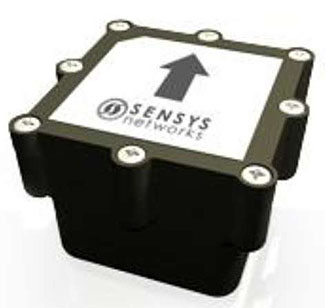
Source: Sensys Networks
In-pavement magnetometer installation video: https://www.youtube.com/watch?v=4Eq-rcGd7kk. This video is now private.
Author Notes for Slide 9:
- How magnetometers work:
- Measure the steady state of the Earth's magnetic field at a particular location
- When vehicles pass over detector, the magnetic field changes, changes are measured by these units
- Can provide volume, occupancy, speed, vehicle lengths (replacement to inductive loops)
- Microloops shortcomings
- Limited lead-in distance
- Require directional boring across roadway at a constant depth
- Wireless (puck style) shortcomings
Slide 10: Vehicle Detection
Point Detection
- Infrared Detectors
- Use infrared light cones sent from transmitter to receiver on other side of road
Source: Ceos
Author Notes for Slide 10:
- How infrared detectors work:
- Two infrared light cones transmitted across roadway
- Measured as vehicles break and remake these cones
- Can provide volume, speed, vehicle classification
- Can determine number of axles per vehicle; vehicle classification is achieved using inter-axle spacing
Slide 11: Vehicle Detection
Point Detection
- Light Emitting Diode (LED) Detection
- Emits light via the diode and uses optical sensor to sense reflection (time-of-flight of light)
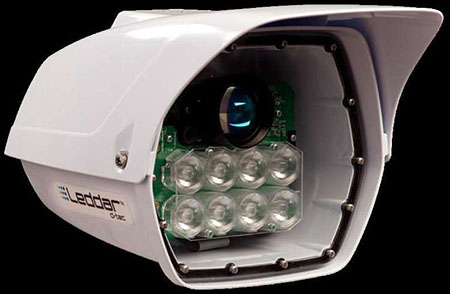
Source: Leddar Tech
Author Notes for Slide 11:
- How LED detectors work:
- Diodes emit light at detection zone
- Optical sensor senses reflections off vehicles
- Distance from unit calculated based on time-of-flight of light
- Can provide volume, speed, vehicle classification
Slide 12: Vehicle Detection
Probe Detection
Intended to capture a specific portion (subset) of vehicles moving through detection zone
- Cellular Telephones
- Handset-based systems use device's GPS
- GPS must be active
- Network-based systems use cellular triangulation
- 3-step process using sophisticated algorithms
Author Notes for Slide 12:
- Define probe detection
- Vehicles must have technological identifier to be detected
- Cellular telephone probe detection using GPS
- GPS device must be active (e.g., Google Maps or a traffic application is open)
- Cellular telephone probe detection using triangulation
- Probe is roughly located
- Map matching is used to assign probe to road network
- Signal characteristics are analyzed and data are aggregated to get traffic information
Slide 13: Vehicle Detection
Probe Detection
- Bluetooth and Wi-Fi Sensors
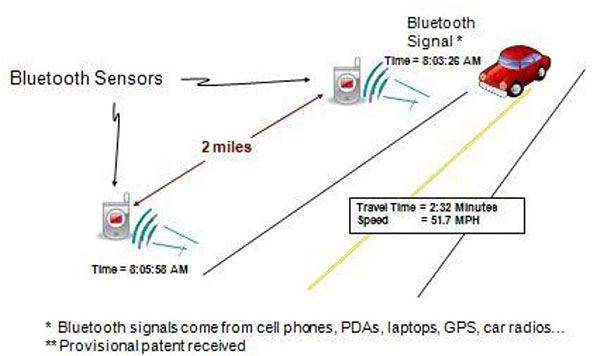
(Extended Text Description: This is a diagram illustrating Bluetooth sensor coverage on a road. In the diagram there is a vehicle driving down a road. On the left side, there are two Bluetooth sensors placed alongside the road. Distance been the sensors is two miles. As the vehicle approaches the first sensor, a Bluetooth signal timestamp 8:03:26AM is recorded. A timestamp of 8:05:58AM is recorded at the second Bluetooth Sensor. The travel time and speed calculated are 2:32 minutes and 51.7 MPH. At the bottom of the diagram, are the following notes: "Bluetooth signals come from cell phones, PDAs, Laptops, GPS, Car radios… " and "Provisional patent received.")
Source: Traffax Inc.
Author Notes for Slide 13:
- Both sensors broadcast discovery messages with unique identifiers (properly managed to mitigate privacy concerns)
- Roadside sensors detect devices at a specific location and timestamp
- Correlating a device's timestamps across two or more detectors can provide travel times and link speeds
- Penetration rates (5-25%), built-in latency (i.e., new data are produced only after vehicle has passed through link)
Slide 14: Vehicle Monitoring and Tracking
Used when the characteristics (e.g., location) of a specific vehicle (e.g., a bus) are important
- GPS-based Systems
- Use satellites to determine latitude/longitude (lat/long) of GPS receiver located in vehicle
- Passive tracking
- Active tracking (2-way GPS)
Author Notes for Slide 14:
- Vehicle detection focuses on detecting the presence and/or characteristics (e.g., speed) of vehicles in general
- Vehicle monitoring and tracking focuses on detecting (and tracking) a specific vehicle
- GPS-based systems use satellites to determine location (lat/long) of GPS receiver in vehicle
- Passive tracking systems will store the data within the GPS tracking system itself
- Active tracking systems send the information to a centralized database or system via a modem within the GPS system unit on a regular basis (e.g., transit systems that provide vehicle arrival times in real time)
Slide 15: Vehicle Monitoring and Tracking
- Transponder and Radio Frequency Identification (RFID)-based Tracking
- Basic Radio Frequency Identification System:
- Active/Passive transponders
- Transponders can be linked to users (e.g., tolling accounts)
- Probe detection capability
Author Notes for Slide 15:
- Basic Radio Frequency Identification (RFID) systems consists of:
- Tags (located in the vehicle)
- Antennas (located roadside attached to the reader, used to adjust the read zone)
- Readers (located roadside, broadcasts RF energy and reads the reflected RF information)
- Active most used in ITS, passive mostly for freight
- Transponders can be linked to people making them useful in applications such as tolling
- Unique vehicle identifier provides probe detection capabilities similar to Bluetooth/Wi-Fi sensors
Slide 16: Vehicle Monitoring and Tracking
- License Plate Readers
- Automated Number Plate Recognition (ANPR)
- Video or still cameras capture images
- Image processing used to provide alphanumeric conversion
- License number and timestamp sent to central system
- Useful in tolling applications
- Probe detection capability
Author Notes for Slide 16:
- License Plate Reader (LPR) process:
- Automated number plate recognition
- Video or still camera captures image of vehicle/plate
- Image is processed to extract license plate characters
- Plate number and timestamp are recorded and sent to the central system
- This technology lends itself especially well to toll collection with high volumes of traffic in a single direction and where evidentiary proof may be necessary
- Unique vehicle identifier provides probe detection capabilities similar to Bluetooth/Wi-Fi sensors
Slide 17: Communications
Wired Communications
- Fiber Optic Cable
- Light pulses transmitted down optical cable
- Multimode fiber vs. Single-mode fiber
- 1.5 Gbits/s bandwidth
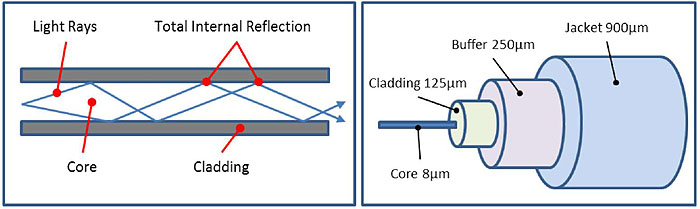
(Extended Text Description: There are two diagrams in this image. On the left is an illustration of how light travels down a fiber optic cable. The fiber optic cable is shown as a white tube in between gray rectangles representing cladding on top and on the bottom. Within the fiber optic line, blue lines represent light rays bouncing off the walls of the cable. The point at which the light ray hits the clad is called "Total Internal Reflection." The very center of the fiber optic cable is called the core. The diagram on the right shows how a fiber optic line is packaged. In the very center is 8um of fiber optic core. The core is surrounded by a 125um cladding. Around the cladding is 250um of buffer. And finally surrounding the buffer is a 900um thick jacket.)
Source: Brody Hanson Consulting
Author Notes for Slide 17:
- Light pulses are transmitted down an optical cable, similar to how electrical signals are sent down copper cable
- Multimode fiber has a relatively large light-carrying core used for short-distance transmissions with LED-based fiber optic equipment. Single-mode fiber has a small light-carrying core used for long-distance transmissions with laser-diode-based fiber optic transmission equipment.
- Typical bandwidth is 1.5 Gigabits/s
Slide 18: Communications
Wired Communications
- Twisted Wire Pair (TWP)
- Most common technology in traffic management systems (TMS)
- Two conductors of a single circuit twisted together
- Cancels out electromagnetic interference
- Cables typically shielded
- Serial communications
- Ethernet over TWP now possible
- Leverage existing infrastructure
Author Notes for Slide 18:
- Most common in TMS
- Cable:
- Two conductors of a single circuit are twisted together
- This cancels out electromagnetic interference
- Cables are typically shielded
- Traditionally TWP was limited to slow serial communications. Advancements in technology have led to the widespread use of Ethernet over TWP in ITS and transportation management applications, leveraging existing infrastructure by increasing bandwidth.
Slide 19: Communications
Wired Communications
- Ethernet Cable
- Connects network devices using Ethernet protocol
- CAT5/CAT6
- Four pairs of copper wire
- Limited length (328 feet)
- Standard connectors (e.g., RJ45)
- Bandwidths 100-1000 Mbits/s
- Power over Ethernet (PoE)
The creator of Ethernet discusses its development:
https://www.youtube.com/watch?v=g5MezxMcRmk
Author Notes for Slide 19:
- Although Category 6 (CAT6) cable is becoming increasingly common, currently the most common standard is Category 5 (CAT5)
- CAT5 is an Ethernet network cable standard defined by the Electronic Industries Association and Telecommunications Industry Association (EIA/TIA)
- Four pairs of copper wire
- Limited length (328 feet)
- 8P8C modular connectors, often referred to as RJ45, are used for connecting CAT5 cable
- Bandwidths range between 100 and 1000 Mbits/s depending on cable
- Power over Ethernet (PoE) describes a standardized system to pass electrical power along with data on Ethernet cabling
- Provides data and power in same cable over relatively long cable lengths
Slide 20: Communications
Wired Communications
- Leased Communication Services
- Telephone lines
- 19.2-56 Kbit/s
- Digital subscriber lines (DSL)
- 256 Kbit/s-40 Mbit/s
- Cable
- 100-400 Mbit/s
- Virtual private networks
Author Notes for Slide 20:
- Leased communication services leverage private sector infrastructure and come in a variety of forms
- Telephone lines
- Legacy technology
- Sending and receiving modems over voice lines
- Urban traffic control systems due to low bandwidth requirement
- 19.2-56 Kbit/s
- DSL
- Uses higher frequency bands over telephone lines to achieve higher bandwidths
- 256 Kbit/s-40 Mbit/s
- Cable
- Uses cable television infrastructure, modem and coaxial cable o 100-400 Mbit/s
- Private sector offers Virtual Private Network over their leased lines
- Enables widespread private network without dedicated infrastructure costs
Slide 21: Communications
Wireless Communications
- Spread Spectrum Radio
- Unlicensed frequencies
- Line of sight required
- Serial and Ethernet
- 230 Kbit/s (serial) and 22-54Mbit/s (Ethernet)
- Terminal servers
Author Notes for Slide 21:
- Spread spectrum radio uses unlicensed frequencies of 900MHz, 2.4GHz, and 5.4GHz
- Transmission path study usually required to determine line of sight
- Serial and Ethernet communications can be used to provide the following bandwidths
- 230 Kbit/s (serial) and 22-54Mbit/s (Ethernet)
- High bandwidth trunk lines often used with low bandwidth local networks
- Terminal servers are devices that convert serial-Ethernet and vice versa so that serial/Ethernet links can be combined in the same network
Slide 22: Communications
Wireless Communications
- Wi-Fi/WiMAX
- Wi-Fi
- Local area network product
- Based on IEEE802.11
- 52 Mbit/s bandwidth with approx. 200 ft. range
- WiMAX
- High bandwidth extended range networks
- Based on IEEE802.16
- 70 Mbit/s bandwidth with approx. 30 mile range
Author Notes for Slide 22:
- Wi-Fi provides Local Area Network connectivity
- Based on IEEE standard 802.11
- 52 Mbit/s bandwidth with approx. 200 ft. range
- Wireless adapters (e.g., smartphones) connect to Wireless Access Points (WAP) which are connected to wired networks via an Ethernet router or switch
- WiMAX is similar to Wi-Fi but faster and on a larger scale employing high bandwidth extended range networks
- Based on IEEE802.16
- 70 Mbit/s bandwidth with approx. 30 mile range
- New standards could provide bandwidths up to 1Gbit/s
Slide 23: Communications
Wireless Communications
- Cellular Data
- Global Systems Mobile (GSM)
- HSPA (7.2Mbit/s)
- HSPA+ (42Mbit/s)
- Code Division Multiple Access (CDMA)
- Long Term Evolution (LTE)
Author Notes for Slide 23:
- Based on TCP/IP
- Latency depends on network loads
- GSM technology divides the frequency bands into multiple channels so that more than one user can send data through one tower at the same time
- HSPA = High Speed Packet Access -7.2Mbit/s bandwidth
- HSPA+ = Evolved HSPA -42Mbit/s bandwidth
- CDMA networks layer digitized "calls" over one another, and unpack them on the back end with sequence codes
- EvDO = Evolution Data Only - 3.1Mbit/s bandwidth
- LTE = Long Term Evolution - 150Mbit/s bandwidth
- LTE is data focused with voice secondary
- LTE Advanced may offer up to 1Gbit/s
Slide 24: Central Hardware and Systems
Central Systems
- Multiple Servers
- Application, database, communications, video, etc.
- Operator interface
- Video walls
- Central server
- Windows or Linux
- Climate controlled room
- Can be outsourced
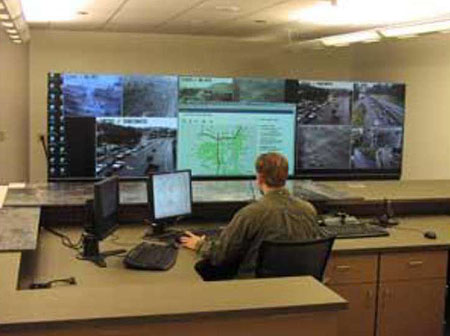
Source: City of Bellevue, WA
Author Notes for Slide 24:
- Central systems consist of multiple servers:
- Application servers, databases, communications servers, video servers are examples
- PCs are the most popular form of operator interface
- Video walls are becoming more popular, LED walls consume the least power
- Central servers can be in house or outsourced
- Windows or Linux
- Typically contained in a climate controlled room
Slide 25: Central Hardware and Systems
Field Traffic Controllers
The controller, typically connected to a UPS, is the intelligence of the local system, providing a common point to connect, monitor, and control field equipment
- Type 170
- Specification developed by Caltrans in 1970s
- 8-bit microprocessor
- Serial communications
- 19" cabinet rack
Author Notes for Slide 25:
- Controller interfaces to ITS equipment and integrates system
- Common point to connect, monitor and control field equipment
- The Uninterruptible Power Supply provides several hours of emergency power when the main input power source fails
- 170 specification developed by Caltrans
- Specifies form, fit, function
- 8-bit microprocessor
- Discrete inputs, 104-pin C1 connector
- Serial comm. with Ethernet conversion options
- 19-inch cabinet rack
Slide 26: Central Hardware and Systems
Field Traffic Controllers
- Type 2070
- Specification began in CA in 1992
- Successor to 170
- Form, fit, function, shape, materials, and specific hardware architecture and microprocessor
- Real time operating system (OS-9)
- Built-in Ethernet and serial comm. (Fiber option)
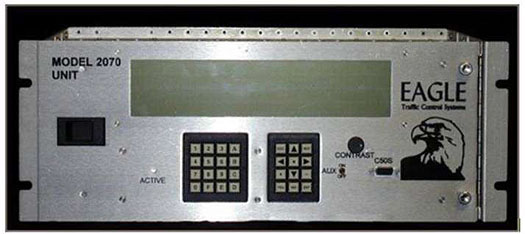
Source: FHWA
Author Notes for Slide 26:
- 2070 specification developed in California
- Intended to replace 170
- Specifies form, fit, function, shape, materials, hardware architecture, and microprocessor
- Real time OS
- Multiple comm. Options
- Built in Ethernet and serial
- Fiber option
- Modules allow installation in National Electrical Manufacturers Association (NEMA) cabinets
Slide 27: Central Hardware and Systems
Field Traffic Controllers
- National Electrical Manufacturers Association (NEMA)
- Standard (rather than specification)
- TS1, TS2 Type 1, TS2 Type 2
- Controller-cabinet interface (A, B, C)
- Supports serial and Ethernet comm.
- Hardware and software procured together
Author Notes for Slide 27:
- National Electrical Manufacturers Association controller is a standard, not a specification
- Various versions
- TS1, TS2 Type 1, TS2 Type 2
- Various connectors/controller-cabinet interface
- Standardized nomenclature and terminology
- Serial and Ethernet comm. options
- Hardware/software always procured together (2070 and ATC can be procured separately)
Slide 28: Central Hardware and Systems
Field Traffic Controllers
- Advanced Transportation Controller (ATC)
- Standard (rather than specification) began in 2005
- Current version is 5.2b
- Focuses on API
- Linux operating system
- Enables applications requiring sophisticated algorithms
- Queue warning, border wait time, etc.
Author Notes for Slide 28:
- ATC controller is a standard, began in 2005, intended to replace 2070
- Current version is 5.2b
- ATC de-emphasizes the form and fit of the controller and focuses on the functionality and Application Programming Interface (API) or the hardware-level interfaces for communications to peripheral devices such as serial ports, Ethernet ports, USB drives and flash memory arrays, and displays
- Linux operating system
- Most ATCs are traffic controllers, but well suited for advanced systems such as queue warning and border wait time
Slide 29: Dynamic Message Signs
- DMS: National ITS Architecture terminology
- Large electronic signs display traveler information
- Traffic conditions
- Travel times
- Construction
- Incidents
- Traditional DMS
- Three-line monochrome
- Two-phase max
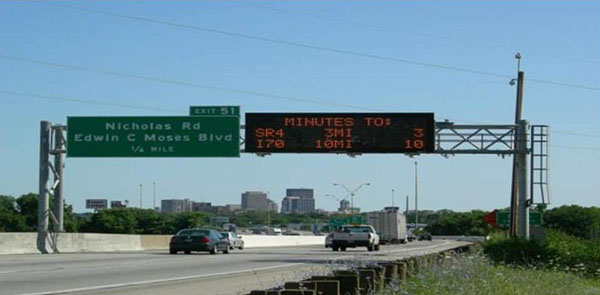
Source: Ohio DOT
Author Notes for Slide 29:
- Dynamic Message Signs (DMS) are used to disseminate relevant information to motorists along the roadway
- DMS is the preferred term according to the National ITS Architecture, although some jurisdictions still use other terms interchangeably, such as Variable Message signs (VMS) or Changeable Message Signs (CMS)
- Purpose is to display traveler information:
- Traffic conditions
- Travel times
- Construction
- Incidents
- Traditional DMS are monochrome and are limited to three lines of text only (a practical limitation as DMS standards do not preclude using more than three lines)
- Multiple three line messages can be cycled to increase the amount of information a sign can provide. Usually no more than two cycles (or 2-phases) are presented at any given time due to the time it takes a motorist to read and process this information
- Overhead signs can be made to provide maintenance access from the front, from the rear, or from the side using a walk-in configuration
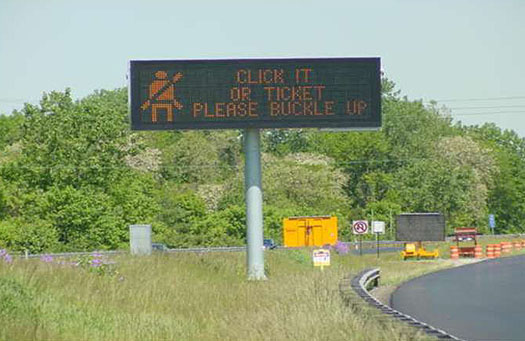
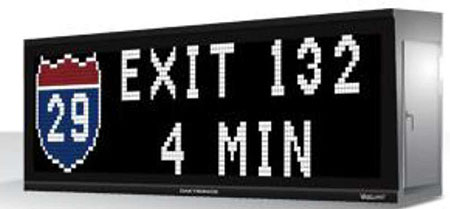
Slide 30: Dynamic Message Signs
- Messages are displayed via the sign controller
- Automatically (based on traffic conditions)
- Remotely (operator initiated)
- LEDs act as pixels
- Full matrix displays
- Full color, full matrix displays
Source: Ohio DOT
Source: Daktronics
Author Notes for Slide 30:
- DMS operation is governed by the sign controller
- Messages can be stored on a central server, created on-demand by the central server (or operator) based on a template, or contained in the sign’s internal message library
- Messages can be displayed automatically based on traffic conditions or remotely by an operator
- Each LED in the sign acts as a pixel in the display
- Full matrix allow images to be displayed
- Full-color full matrix provides the ability to more closely emulate road shields and other MUTCD-compliant graphical elements
- Reproducing graphical elements that drivers are used to seeing may help mitigate the issue of driver distraction by reducing the amount of time a driver needs to read and process the information contain on the DMS
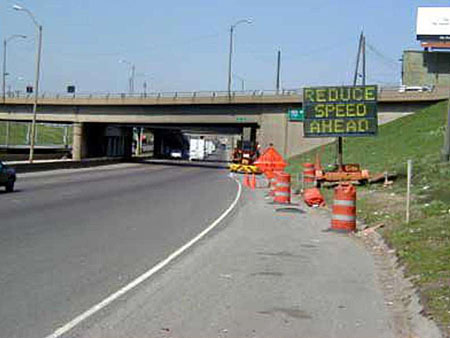
Slide 31: Dynamic Message Signs
- Portable DMS
- Transportable
- Ideal for temporary applications (e.g., work zones)
- Trailer mounted
- Solar/battery powered
- Cellular data comm.
- Onboard GPS
Source: FHWA
Author Notes for Slide 31:
- Portable DMS are designed to be easily transportable
- Much small than fixed DMS
- Ideal for temporary applications such as work zones
- Trailer mounted with standard trailer hitch
- Solar/battery powered - battery sized based on prevailing weather conditions for region
- Cellular wireless comm. used to communicate with sign
- Onboard GPS units used to located DMS
Slide 32: Video Cameras
A camera system comprises:
- Camera
- Housing
- Monitor/recorder
- Central control system
- Supporting infrastructure
- Pole on which the camera unit is mounted
- Power
- Communications equipment
- Traffic cameras mounted at 35'-100'
- Provide pan, tilt, zoom (18x-35x)
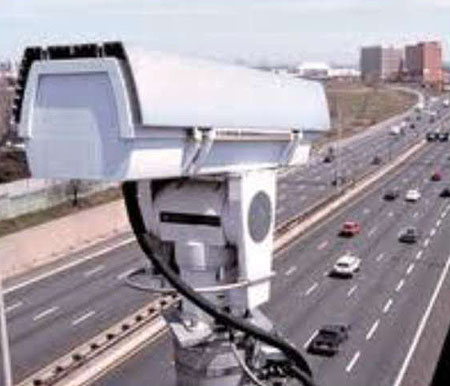
Source: FHWA
Author Notes for Slide 32:
- Components of a camera system:
- Camera
- Housing
- Monitor/recorder
- Central control system
- Supporting infrastructure:
- Mounting pole, power, comm. equipment
- Traffic cameras typically mounted at 35'-100'
- Most offer Pan-tilt-zoom (PTZ) functionality with optical zoom of 18x-35x
Slide 33: Video Cameras
- Standard Enclosure
- Mounted on pan/tilt unit
- Newer units provide 90/360 tilt/pan
- Dome Cameras Traffic cameras mounted at 35'-100'
- 90/360 tilt/pan
- Lowering device
- Environmental Considerations
- Precipitation
- Temperature
- Lighting
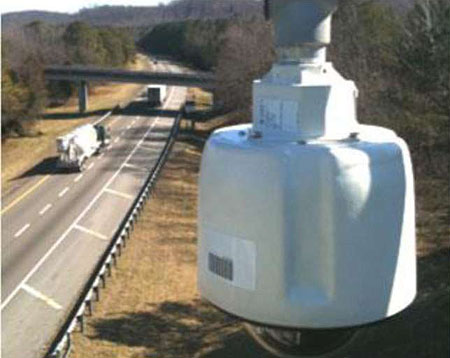
Source: FHWA
Author Notes for Slide 33:
- Standard enclosures
- Pan-tilt functions provided by separate unit on which camera is mounted
- Newer units provide 90 degree tilt and 360 degree pan
- Dome enclosures
- Pan-tilt functions are integrated, providing 90 degree tilt and 360 degree pan
- Includes lowering device to make maintenance easier
- Environmental considerations
- Precipitation - wipers, demisters, lens coatings can help
- Temperature - built in heaters
- Lightening - surge protectors and lightning rods
- Lighting - auto-iris function
Slide 34: Video Cameras
- IP Cameras
- Integrate:
- Analog-to-digital video conversion
- Video compression
- Ethernet communication
- Reduce equipment required for multiple feeds
- Enable portable camera applications
- On-vehicle Cameras
- Combine IP cameras, rugged enclosures, and Power over Ethernet
Author Notes for Slide 34:
- Traditional cameras provided analog signal, IP cameras integrate everything
- Analog-to-digital video conversion
- Video compression
- Ethernet communication
- Digital feed is easily transmitted to multiple recipients, reducing required equipment for multiple feeds
- Enables portable camera applications when combined with wireless comm. device
- On-vehicle cameras are popular in transit vehicles
- Combine IP cameras, rugged enclosures, and power over Ethernet
Slide 35: Road Weather Information Systems (RWIS)
Environmental Sensing Stations
- Sensors
- Remote processing unit
- Power supply
- Batteries
- Communications
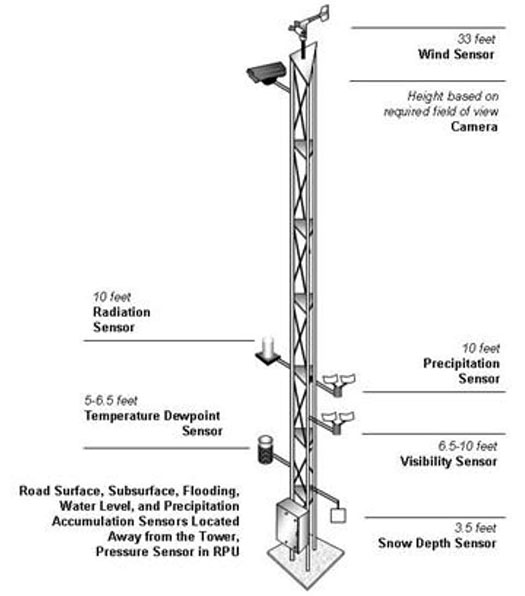
(Extended Text Description: This is an illustrated diagram of a Road Weather Information System (RWIS). The RWIS is a metal tower that has many different sensors mounted onto its sides. From bottom to top, sensors mounted onto the system include a snow depth sensor (3.5 feet), a Temperature Dewpoint Sensor (5-6.5 feet), a Visibility Sensor (6.5-10 feet), a Precipitation Sensor (10 feet), a Radiation Sensor (10 feet), and at the top, a camera, and a wind sensor (33 feet). The height of the camera is based on the required field of view. Road Surface, Subsurface, Flooding, Water Level, and Precipitation Accumulation sensor are located away from the tower, Pressure Sensor in the RPU.)
Source: FHWA
Author Notes for Slide 35:
- Environmental Sensing Stations are the key supporting technology behind RWIS
- Field components of RWIS:
- Multiple sensors
- Remote processing unit located in a cabinet
- Power supply
- Batteries
- Communications equipment
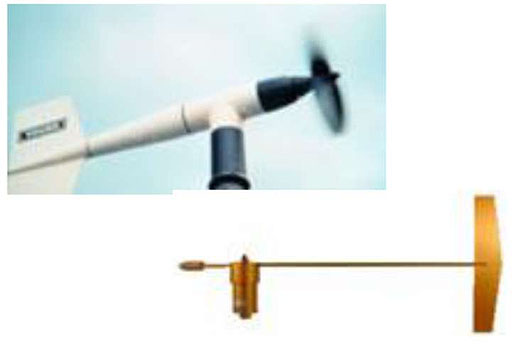
Slide 36: Road Weather Information Systems (RWIS)
Air Sensors
- Wind Vanes
- Measure wind direction and speed
- Pressure
- Mercury or aneroid barometers
- Temperature/Dew-point Sensor
- Liquid, gas, or electrical thermometers
- Dew-point, capacitor, or electrical hygrometers
Source: FHWA
Author Notes for Slide 36:
- Wind vanes
- Measure wind direction and speed
- The tail causes the wind vane to rotate in the horizontal plane
- Wind speed is typically measured by anemometers with propellers or cups
- 33 feet above ground
- Pressure
- Pressure is measured using mercury or aneroid barometers o Aneroid are more accurate
- Temp/dew point
- Thermometers can be liquid, gas, or electrical
- Hygrometers can be electrical, dew-point, or capacitor
- Should be housed in radiation shield 5-6.5 ft. above the ground, extended 3 ft. from tower
Slide 37: Road Weather Information Systems (RWIS)
Precipitation Sensors
- Precipitation Accumulation Sensor
- Tipping bucket, weighing rain gauge, float-type rain gauge, or hotplate snow gauge
- Snow Depth Sensor (ultrasonic or infrared)
- Road Surface Sensor
- Active, passive, or non-intrusive
- Subsurface Sensor
- Soil thermometer or geo-thermometer
- Water Level Sensor
- Ultrasonic, stilling well, tide gauge, or standpipe mast
Source: FHWA
Author Notes for Slide 37:
- Precipitation
- Tipping bucket, weighing rain gauge, float-type rain gauge, hotplate snow gauge
- Tipping bucket and weighing rain gauge most common
- Snow depth
- Ultrasonic or infrared
- Uses algorithms to adjust the time, based on the air temperature, and converts it into a distance
- Road surface sensor
- Active generate signal and measure radiation
- Passive detect energy radiating from external source
- Non-intrusive emit microwave or infrared beams
- Subsurface sensor
- Soil or geo-thermometer
- Measure values at various depths
- Water level sensor
- Ultrasonic, stilling well, tide gauge, standpipe mast
- Used to assess flood and storm surge hazards
Slide 38: Road Weather Information Systems (RWIS)
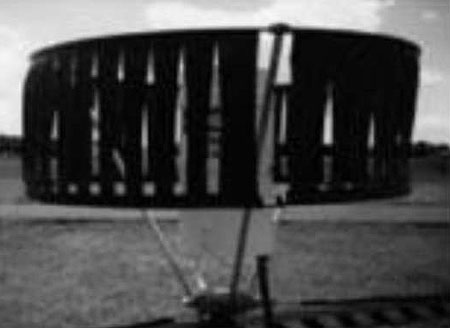
Visibility and Radiation Sensors
- Visibility Sensor
- Optical sensor with forward, or backward scattered
- Video Camera
- Pointed at objects with known distance
- Radiation Sensor
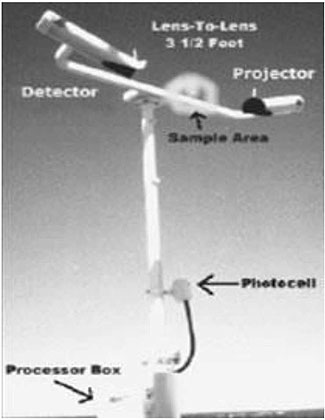
(Extended Text Description: This is an example of a Visibility and Radiation Sensor. This sensor is made up of a long pole with a crossbar mounted at the top. There are multiple devices installed onto this frame. Starting at the base, there is a Processor Box. On the lower half of the post is the photocell. Mounted on the end of the crossbar is a projector and detector on the other end. The air sample area is located in between the projector and the detector. The distance between the two lenses is 3½ feet.)
Source: FHWA
Author Notes for Slide 38:
- Visibility sensor
- Forward/backward scattered optical sensor
- Objects in the air scatter energy (e.g., minute water droplets forming fog), measure scattered light
- Cameras
- Pointed at objects with known distances
- e.g., roadside signs or flashing beacons
- Radiation
- Radiation sensor
- Should be installed 10 feet from surface
Slide 39: Connected Vehicle Technologies
The technology that enables connected vehicle applications
- Roadside Equipment (RSE)
- Static infrastructure component
- Communicates with OBE
- Onboard Equipment (OBE)
- In-vehicle component
- Collects data and transmits to RSE
Author Notes for Slide 39:
This talks about technology that enables connected vehicle only, module 13 discusses applications
- Onboard Equipment (OBE) is the in-vehicle component
- Collects vehicle info (e.g., speed), merges with info about other vehicles (e.g., trajectories and speeds), and transmits to the RSE
- Roadside Equipment (RSE) is the static infrastructure component
- Communicates with OBE
- Can interface vehicle info with other infrastructure (e.g., signals)
- No standard for OBE or RSE but many demonstrations of the capabilities of the technology that enables connected vehicle applications.
Slide 40: Connected Vehicle Technologies
- 5.9GHz DSRC
- Dedicated short-range communications
- Developed specifically for vehicular communications
- IEEE 1609 standard
- Low latency
- Vehicle-to-vehicle (V2V), vehicle-to-infrastructure (V2I), and infrastructure-to-vehicle (I2V)
- Several test beds: Florida, New York, California, Michigan
Author Notes for Slide 40:
- 5.9GHz reserved frequency band using the Wireless Access in Vehicular Environments (WAVE) protocols defined in the IEEE 1609
- DSRC = Dedicated Short-range Communications
- Developed specifically for vehicular communications
- High bandwidth with low latency short-range comm.
- Vehicle-to-vehicle (V2V), vehicle-to-infrastructure (V2I), and infrastructure-to-vehicle (I2V)
- Several test beds: Florida, New York, California, Michigan
- USDOT Safety Pilot in Ann Arbor Michigan is most comprehensive
Slide 41: Summary
- Vehicle Detection
- Inductive loops, radar, laser, video, LED, infrared, magnetometers, Bluetooth/Wi-Fi, cell phones
- Vehicle Monitoring and Tracking
- GPS, transponders/RFID, license plate readers
- Communications
- Fiber, Ethernet, leased lines, TWP, radio, Wi-Fi/WiMAX, cell data
- Central Hardware and Systems
- Field controllers, central systems, operating systems
Author Notes for Slide 41:
This module strived to:
- Promote understanding of the various technologies used in ITS applications
- Encapsulate and group the various physical components of an ITS so that the different types of technologies can be compared and understood
- Using this combination, empower individuals and agencies to make informed decisions in their future ITS deployments
- Vehicle Detection
- Inductive loops, radar, laser, video, LED, infrared, magnetometers, Bluetooth/Wi-Fi, cell phones
- Vehicle Monitoring and Tracking
- GPS, transponders/RFID, license plate readers
- Communications
- Fiber, Ethernet, leased lines, TWP, radio, Wi-Fi/WiMAX, cell data
- Central Hardware and Systems
- Field controllers, central systems, operating systems
Slide 42: Summary (cont'd)
- Dynamic Message Signs
- Fixed, portable, monochrome, color
- Video Cameras
- Standard, dome, IP, on-vehicle
- Road Weather Information Systems
- Air/precipitation/visibility/radiation sensors
- Connected Vehicle Technologies
Remember to clearly define the transportation problem; understand the technology, but don't let technology drive the application
Author Notes for Slide 42:
- Dynamic Message Signs
- Fixed, portable, monochrome, color
- Video Cameras
- Standard, dome, IP, on-vehicle
- Road Weather Information Systems
- Air/precipitation/visibility/radiation sensors
- Connected Vehicle Technologies
Slide 43: References
- Marsh Products, "The Basics of Loop Vehicle Detection," 2000.
- Ontario Ministry of Transportation, "BAS BWB Pre-Detailed Design Report," 2011.
- Coes Pty Ltd., "TIRTL," https://www.ceos.com.au/products/tirtl/.
- LeddarTech, "LeddarTM: The unique LED Detection And Ranging technology," https://leddartech.com/news/.
- Smith, Brian, et al., "Cell Phone Probes as an ATMS Tool," UVACTS-15-5-79. University of Virginia Center for Transportation Studies, 2003.
- Traffax Inc, "BluFAX Concept," 2009, https://www.traffaxinc.com/content/blufax-concept- content is no longer available.
- EE Times, "How Does a GPS Tracking System Work?" 2010, https://www.eetimes.com/how-does-a-gps-tracking-system-work/?utm_source=eetimes&utm_medium=networksearch.
- TransCore, "Enabling Technologies - How RFID Works," 2013, https://www.transcore.com/rfid.
- LYNX Technik Inc., "A Fiber Primer," 2011.
- Mitchell, Bradley, "What Is an Ethernet Cable?" 2013, https://compnetworking.about.com/od/ethernet/f/what-is-an-ethernet-cable.htm.
- Stewart, Fred, Randy Pylant, and Roger Baldevia, Jr, Case Study: Utilizing Ethernet Radios and Communications Processors to Integrate Remote IEDs, Minden, Louisiana: s.n., 2007.20070220 TP6270-01.
Slide 44: References (cont'd)
- Vorakitolan, Ekasit, et al., "Exploiting Trunked Radio to Support ITS Network," s.l. : IEEE, 2011.
- Multi-Tech Systems, "Wireless Technology Guide," 2012.
- City of Windsor, "Communications and Controller Technology Plan," Windsor, Ontario : s.n., 2009.
- Florida Department of Transportation, "ITS Training Program Module 1 - CCTV Systems," https://wbt.dot.state.fl.us/ois/ITS-SystemsEngineering100/index.htm.
- Federal Highway Administration, "Interactive Environmental Sensor Station Page," 2011, https://ops.fhwa.dot.gov/weather/mitigating_impacts/interactive_ess.htm.
- Research and Innovation Technology Association, "Connected Vehicle Test Bed," 2012, https://www.its.dot.gov/cv_basics/index.htm.
- Head, Larry, and Faisal Saleem, "Anthem Connected Vehicle Testbed," 2012, https://www.maricopa.gov/DocumentCenter/View/32895/ITE-Journal-Article-on-Anthem-Test-Bed?bidId=.
- Research and Innovative Technology Administration, "AASHTO Connected Vehicle Infrastructure Deployment Analysis," FHWA-JPO-11-090, 2011.
- Hanson, Trevor, and Coady Cameron, "The potential of smartphone technology to collect road roughness information," Poster presented at the Transportation Association of Canada Annual Meeting, Fredericton, New Brunswick : s.n., 2012.
- NTCIP, "Background. NTCIP," April 4, 2011, https://www.ntcip.org/about/.
Slide 45: Questions?
- What is the difference between point and probe detection?
- What is vehicle monitoring and tracking, as compared to vehicle detection?
- Give an example of a wireless and wired technology
- What are the four main types of field controllers?
- Why are full-color, full matrix signs useful?
- What is an IP camera?
- What is the key component of an RWIS?
- What is the dedicated frequency band used by connected vehicles?
Author Notes for Slide 45:
Answers:
- Point: all vehicles in detection zone are detected; Probe: subset of vehicles in detection zone are detected
- Vehicle monitoring and tracking is concerned with the characteristics of a specific vehicle, where vehicle detection is concerned with the characteristics of vehicles in general
- Wired: Fiber, Ethernet, leased lines, TWP. Wireless: Spread spectrum radio, Wi-Fi/WiMAX, cell data
- 170, 2070, NEMA, ATC
- Images, such as shields/symbols, can be recognized quickly by drivers
- A camera that integrates analog-to-digital conversion, video compression, and Ethernet communication
- Environmental Sensing Station (ESS)
- 5.9GHz
Return to top ↑