← Back to Module 1
ITS ePrimer Presentation
Module 1: Introduction to ITS ePrimer Overview
Slide 1:
ITS ePrimer
Introduction and Overview
ITS Professional Capacity Building Program
ITS Joint Program Office
U.S. Department of Transportation
Author’s slide 1 meeting notes below:
This module is sponsored by the U.S. Department of Transportation’s ITS Professional Capacity Building (PCB) Program. The ITS PCB Program is part of the Research and Innovative Technology Administration’s ITS Joint Program Office.
Thank you for participating and we hope you find this module helpful.
Slide 2:
Instructor

Pat Noyes
Principal
Pat Noyes & Associates
Boulder, CO, USA
Author’s slide 2 meeting notes below:
Pat Noyes & Associates, Boulder, Colorado, 1993-present
Principal specializing in transportation system management and operations (TSMO) and transportation planning.
Slide 3:
Learning Objectives
- Understand the history and current status of ITS
- Be familiar with the 16 subject modules
- Know how to access and use the ITS ePrimer
Author’s slide 3 meeting notes below:
Learning objectives:
- Understand the history and current status of ITS
- Be familiar with the 16 subject modules
- Know how to access and use the ITS ePrimer
Slide 4:
What is ITS?
- ITS applies information, technology, and systems engineering to the management and operation of surface transportation facilities
- It is an engineering discipline that encompasses
- Research
- Planning
- Design
- Integration
- Deployment
Author’s slide 4 meeting notes below:
ITS is an engineering discipline with links to planning and IT disciplines that encompasses the research, planning, design, integration, and deployment of systems. ITS stakeholders are multidisciplinary, representing a broad spectrum of user types and technical experts who, together, develop and constitute the ITS discipline. Each stakeholder brings perspective and knowledge to the profession, and this diversity is necessary to plan, develop, implement, manage, and maintain multimodal ITS. Civil, electrical, computer, and systems engineers; roadway and transit planners; logistics, policy, finance, and management experts; multimodal users; maintenance and operations professionals; public safety and emergency responders; and members of other disciplines that use and support transportation facilities and systems are all integral to the ITS discipline. Each stakeholder is part of a complex and collaborative team that envisions, deploys, and manages ITS.
Slide 5:
Introduction to ITS
- ITS brings diverse disciplines together to deliver
- Safe
- Efficient
- Sustainable transportation
- ITS enhances transportation infrastructure investments
- ITS supports system management and operation
- Multimodal
- Local, regional, state
Author’s slide 5 meeting notes below:
ITS is used to manage traffic and transit, improve safety, provide environmental benefits, and maximize the efficiency of surface transportation systems. This field includes strategic planning; systems architecture, multimodal and multijurisdictional integration of technology, data, and communications interoperability; real-time data monitoring; and timely and accurate user information.
Slide 6:
Examples of How ITS Enhances Our Lives
Adaptive signal control technology uses real-time traffic information to
- Cut costs
- Reduce congestion
- Improve traffic flow
- Reduce emissions
- Respond to incidents, special events, and recurring congestion
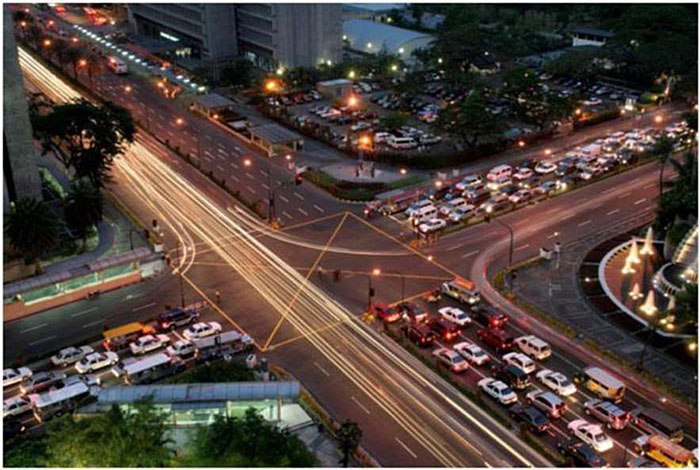
Source: https://www.fhwa.dot.gov/innovation/everydaycounts/edc-1/asct.cfm.
Author’s slide 6 meeting notes below:
Adaptive signal control technology (ASCT) uses real-time traffic information to cut costs and reduce congestion, improve traffic flow, and reduce vehicle emissions. ASCT collects and evaluates traffic data and uses the data to develop and implement signal timing to improve traffic flow. By continually collecting information and updating signal timing to reflect current traffic conditions, ASCT can respond to traffic incidents, special events, recurring traffic congestion, and construction impacts to reduce delays and improve system efficiency. According to the Texas Transportation Institute, traffic congestion costs $87.2 billion in wasted fuel and lost productivity, or $75 per traveler. On average, ASCT improves travel time by more than 10 percent; reducing delays, fuel consumption, and labor costs.
Source:
Other ASCT resources are available at the following sites:
Adaptive Traffic Control in Los Angeles Video
ASCT Case Studies
Training
Slide 7:
Examples of How ITS Enhances Our Lives (cont’d)
Crowdsourcing for Advanced Operations
- Provides real-time information on travel speed and time, traffic incidents, travel behavior, and vehicle operation
- Data can be used by TMCs to manage the system and provide traveler information
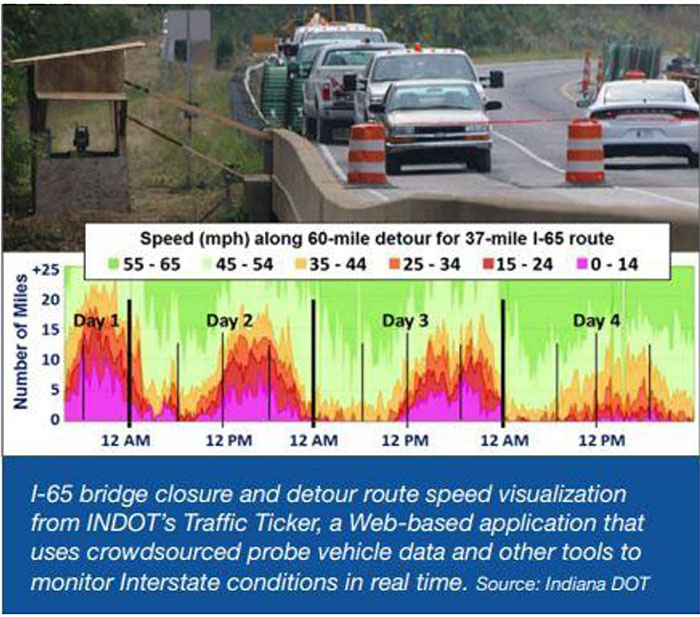
Source: Crowdsourcing for Advancing Operations EDC-6 Factsheet
Author’s slide 7 meeting notes below:
Crowdsourced data from social media platforms, third-party data providers, and mobile applications can provide information on travel speed and time, traffic incidents, travel behavior, vehicular operation, and more. It can provide near real-time data where there are no sensors or cameras. TMCs can integrate this data to more effectively manage the system and provide timely traveler information.
As shown here, the Indiana DOT uses third-party probe data to actively manage major highways. The speed graphic is part of a dashboard created to support operational decision making, training, and after-action reviews.
Slide 8:
Where ITS Can Be Applied
- Multimodal
- Auto
- Transit
- Freight
- Bicycles
- Pedestrians
- Facility Types
- Highways
- Arterials
- Fixed guideways
- Bikeways
- Sidewalks
- Multimodal facilities
- Ports and terminals
Author’s slide 8 meeting notes below:
ITS can be applied to transportation systems including multiple modes (such as automobiles, transit, freight, bikes, and pedestrians) and facility types (such as highways, arterials, fixed guideways, dedicated bikeways, sidewalks, and multimodal facilities). ITS has evolved to encompass programs, applications, and coordination across modes and facility types, thereby increasing the system’s complexity and providing an opportunity to apply systems engineering to support multimodal ITS.
Slide 9:
Systems Engineering
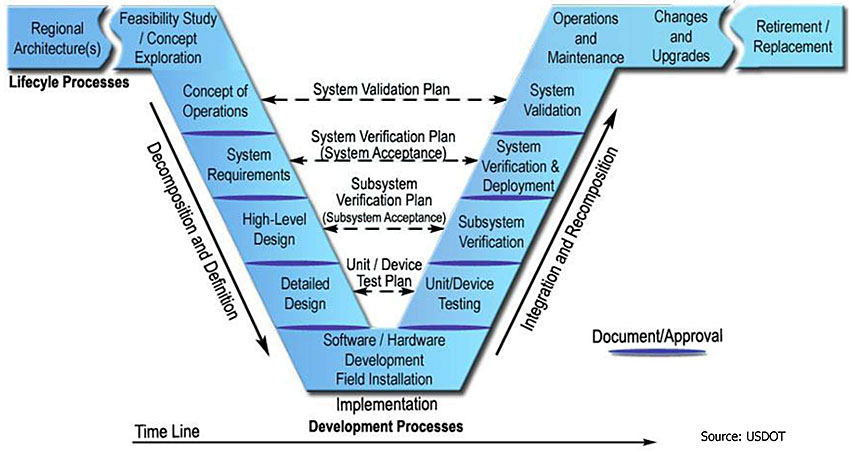
Author’s slide 9 meeting notes below:
Author Notes:
ITS uses a systems engineering approach to plan, design, and deploy technology. Systems engineering provides a framework for the development and application of successful ITS systems. By focusing ITS on customer needs and required functionality, systems engineering integrates multiple disciplines in a structured development process that considers business and technical needs. Systems engineering provides a foundation for ITS development, including the National ITS Reference Architecture that guides ITS from a concept of operations to application deployment. The “V” model used to illustrate the systems engineering process is shown in this slide.
Source: U.S. DOT, Systems Engineering for Intelligent Transportation Systems, 2007
Slide 10:
Transportation Challenges
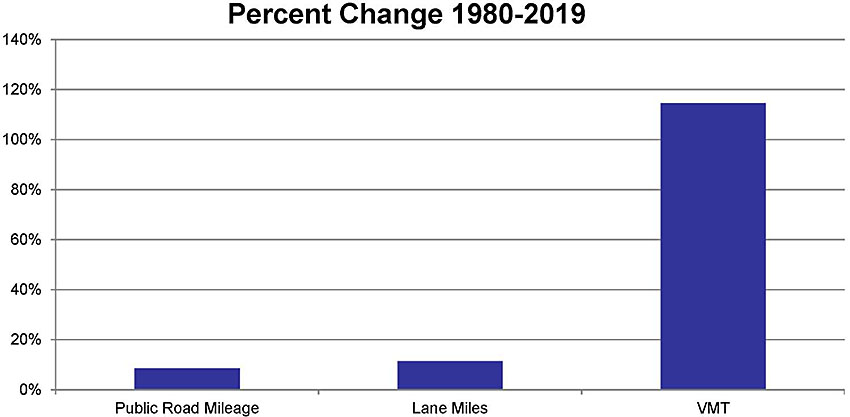
- Increasing demand: 115 percent increase in VMT over 39 years
- Minimal increase in capacity: Less than 11 percent increase in number of lane miles in same period
Author’s slide 10 meeting notes below:
Over the past 40 years, the demand for the use of public roads has increased approximately 115 percent, as measured in vehicle miles traveled (VMT). Over this same time, the number of lane miles on public roads has increased 11 percent. These statistics indicate a sharp rise in demand while capacity, in terms of the number of lane miles, has stayed relatively constant. Although economics, changes in commuting patterns through flextime and telecommuting, and increasing availability of transit options have slowed the growth in VMT, vehicle miles traveled continue to grow. This graph shows the percentage of increase in VMT over a 40-year period and the corresponding increase in capacity. To meet the increasing demand, transportation agencies must manage existing lane miles to maximize safety and efficiency. ITS offers a wide variety of management and operation tools to address increasing demand while enhancing safety and using technology to maximize facility throughput.
Slide 11:
Transportation Challenges (cont’d)
- Funding levels have not kept pace with needs, increasing pressure to do more with less
Author’s slide 11 meeting notes below:
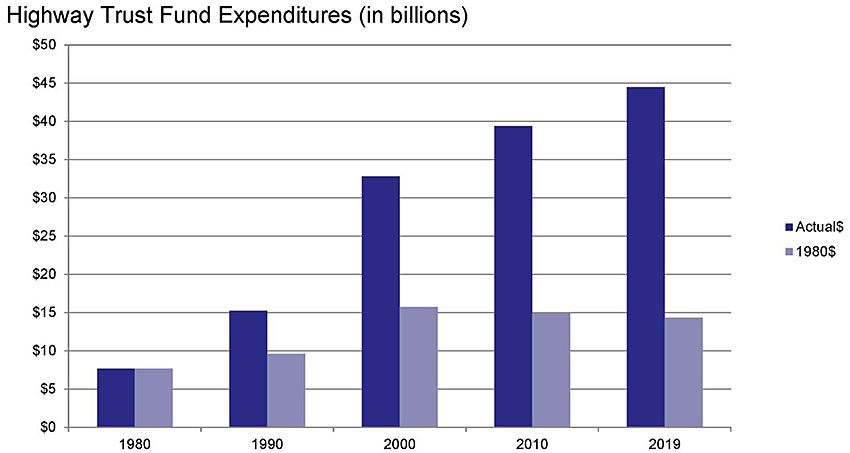
Although actual funding for highways and public transportation has increased every 10 years from 1980 to 2019, limited funding and increasing pressure to do more with less at the beginning of the 21st century have significantly reduced the funding available for highways and public transportation through the U.S. Highway Trust Fund. This graph shows actual annual Highway Trust Fund expenditures in the darker bars and the expenditures adjusted to 1980 dollars in the lighter bars. Looking at the adjusted funding levels, the trend in funding has gone down over the last 20 years. The growing demand for transportation, indicated by the significant increase in vehicle miles traveled since 1980, and limited funding for transportation improvements require the efficient operation of limited infrastructure and new and innovative ways to safely manage the existing transportation system. ITS technologies support operational strategies such as ATM and ICM to address congestion and system reliability.
Slide 12:
Workforce Needs
- Traffic Data Scientist/Statistician
- TSMO Manager/Chief/Bureau Director
- TSMO Program Manager
- Computer Engineer
- Artificial Intelligence Scientist
- Telecommunications Engineer
- Data Management Specialist
- Visualization Specialist
- Connected and Automated Vehicles (CAV) Program Manager
- Traffic Incident Management (TIM) Program Manager
- Cyber Security Engineer
- Transportation Data Ethicist
- Surface Weather Specialist
- Systems Engineer
- TSMO Modeling Specialist
- Emerging Technologies Industry Liaison
- Transportation Systems Performance Manager
- Integrated Corridor Management Manager
- Transportation Management Center Manager
Author’s slide 12 meeting notes below:
As ITS evolves and expands its role in the transportation field, the workforce must also change to meet increasing reliance on technology and data analytics. Knowledge, skills, and abilities (KSAs) needed to support ITS deployment and expansion is an ongoing challenge in transportation organizations. ITS is a critical tool in transportation systems management and operations (TSMO), defined by FHWA as “a set of strategies that focus on operational improvements that can maintain and even restore the performance of the existing transportation system before extra capacity is needed.” (FHWA, What is TSMO?) Recent work by the National Cooperative Highway Research Program (NCHRP) and the National Operations Center of Excellence (NOCoE) has focused on the challenges facing transportation systems management and operations (TSMO) in general, including specific knowledge, skills, and abilities (KSAs) and workforce development needs for ITS. The NCHRP Project 20-07 Transportation Systems Management and Operations (TSMO) Workforce Guidebook, developed for the Transportation Research Board (TRB) of The National Academies of Sciences, Engineering and Medicine in 2019, provides guidance on recruiting, developing, and retaining a TSMO professional workforce, shown in this table. It also provides sample position descriptions for 19 new and emerging positions and catalogs of educational resources.
Slide 13:
Benefits of ITS
- Improved safety
- Reduced congestion
- Reduced emissions
- Reduced travel times
- Enhanced access and quality of life
- Crash prevention
- Cost savings for commercial vehicle operations
- Enhanced travel options
Author’s slide 13 meeting notes below:
ITS applications can be used to improve safety, mobility, reliability, and the environment. They are used to provide traveler information, manage system demand, and enhance travel options and livability while minimizing capital and operating costs to system owners, operators, and users. ITS technologies offer a wide variety of benefits for personal, commercial, and public transportation, such as making trip scheduling and mode selection easier, and provide public safety improvements by managing transportation systems during incidents, emergencies, and natural disasters.
The main purpose of ITS is to enhance system efficiency and safety. System efficiency supports the larger economy and environment while minimizing costs to system owners, managers, and users. ITS benefits transportation system users by reducing travel time and cost, simplifying toll and fare collection, and enhancing safety. Commercial carriers save time and money with electronic screening, timely route information, and port and terminal management.
The 2019 ITS Deployment Evaluation Executive Briefing looked at ITS benefits, costs, and lessons learned in the ITS Knowledge Resources databases and summarized the benefits and costs across 15 application areas. Executive briefings were developed for each of these application areas. The benefits include those listed here.
Slide 14:
History of ITS
Author’s slide 14 meeting notes below:
USDOT ITS JPO published a history of ITS, available on their website. It offers a valuable overview of ITS over three decades.
Slide 15:
History of ITS
- 1988: Mobility 2000 - working group focused on national program of automated technology
- 1991: ISTEA - encouraged new technologies to improve safety, information exchange, system capacity, and travel times
- 1990s: National Architecture and Standards Program initiated
- Late 1990s: Term “ITS” emerged to include more multimodal focus
Author’s slide 15 meeting notes below:
Management and operation of surface transportation systems that focus on safety and efficiency can be traced back to the mid-20th century, when roadway planners began to address increasing commuter travel and system congestion. During the 1980s and early 1990s, many of the technological advances in computing and communications enabled the development of applications that spawned modern ITS programs. In 1988, the USDOT Federal Highway Administration (FHWA) convened Mobility 2000, a working group focused on developing a national program of automated technology. The group brought together public, private, and academic representatives to explore and promote the application of advanced technologies on highways to improve safety and efficiency.
The 1991 Intermodal Surface Transportation Efficiency Act (ISTEA) and subsequent reauthorization encouraged new technologies to improve safety, information exchange, system capacity, and travel times. These initiatives spawned the development of ITS and technology applications that form the foundation of the modern ITS program in the United States. ISTEA also required the development of standards and protocols to promote compatibility among the technologies that were being deployed by state and local agencies. The initial development of the National ITS Architecture began in the mid-1990s, with the involvement of multidisciplinary public, private, and academic teams, which provided the foundation for current ITS national and regional architectures.
The term intelligent transportation systems emerged in the late 1990s to include a more multimodal focus. The USDOT’s ITS program is structured to meet a wide variety of user needs through ITS strategies and technologies. Advances in ITS development include expanded multimodal applications such as transit operations, intermodal and commercial vehicle operations, and integrated traveler information. These applications support a systems approach to surface transportation that allows the sharing of information and ITS infrastructure across multiple modes of transportation.
Slide 16:
History of ITS (continued)
- 2012: Moving Ahead for Progress in the 21st Century (MAP-21) - created a streamlined, performance-based surface transportation program with an increased focus on system management
- 2014: NHTSA proposed rulemaking supporting V2V communication technology research
- 2015: Fixing America’s Surface Transportation (FAST) - largely continued previous program structures with an 11 percent increase in funding over 5 years
Author’s slide 16 meeting notes below:
Increased focus on intelligent vehicles has evolved over the past decade to enhance safety, operations, and the environment through vehicle-based applications and technologies, including collision avoidance, driver assistance, and collision notification. These applications, developed in partnership with vehicle manufacturers, offer opportunities to expand ITS capabilities with minimal infrastructure costs. This evolution to a system of connected vehicles will reduce the need to invest in large, centralized infrastructure-based systems while supporting and expanding system capabilities.
Recent enhancements in technology and infrastructure include public-private partnerships between USDOT and auto manufacturers to test connected vehicle applications and private sector products and services such as smartphone applications that provide real-time information on route options and selection, ridesharing, parking, and transit times. ITS continues to evolve and to expand the application of systems engineering and technology to the transportation system. The National ITS Architecture provides support and guidance for ITS expansion continue to address new developments in technology.
The 2012 surface transportation funding legislation, Moving Ahead for Progress in the 21st Century (MAP-21), transformed the policy and programmatic framework for investments in transportation; created a streamlined and performance-based surface transportation program; and built on many of the highway, transit, bike, and pedestrian programs and policies established in 1991 with the passage of ISTEA.
An increased focus on performance measures and system management changed the role of ITS in two fundamental ways. First, ITS offers greater system efficiencies with potentially smaller investment than capacity-expanding infrastructure programs; therefore, a performance-based system may favor increased investments in the operational and safety capabilities offered through ITS. Second, ITS is built on the collection, exchange, and evaluation of management and operations data. This data will be critical to any performance-based system. ITS infrastructure and personnel are uniquely positioned to support data-driven, performance-based policies and processes.
MAP-21 required states and metropolitan planning organizations to set performance targets and report annually on their progress. The integration of management and operations into regional and statewide planning requires coordination with regional ITS architecture and collaboration with multiple jurisdictions and multimodal providers. Regional ITS architectures, which are modeled on the National ITS Architecture, provide a foundation for linking planning and operations and support the delivery of regional planning objectives for operations. Integrated regional planning, performance measures, and ITS architecture promote efficiency, safety, and reliability of transportations systems while leveraging limited resources to meet shared goals and objectives.
The Fixing America’s Surface Transportation (FAST) Act, signed into law on December 4, 2015, largely maintains the previous program structures and funding shares, increasing funding by 11 percent over 5 years.
Source:
Additional information on the FAST Act is available at https://www.fhwa.dot.gov/fastact/index.cfm
Slide 17:
USDOT CARMA Program
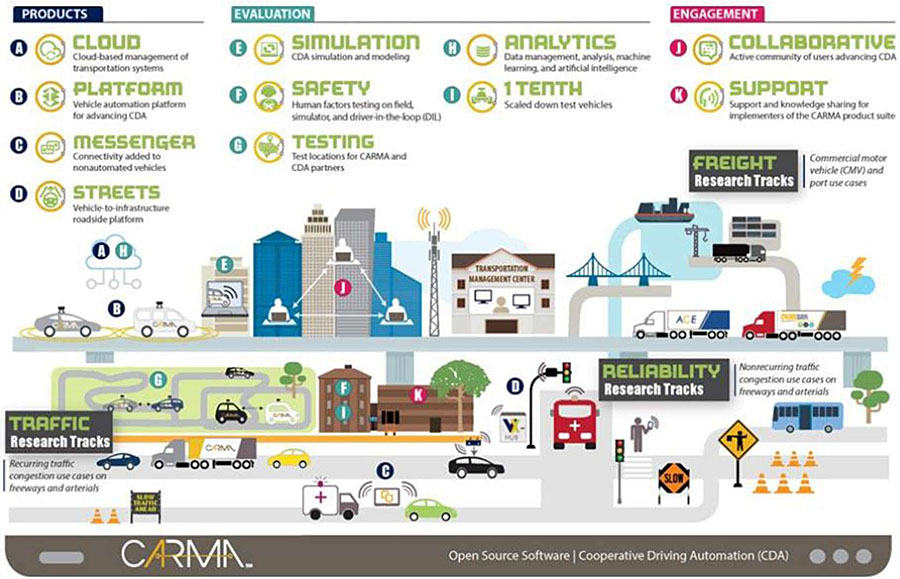
Author’s slide 17 meeting notes below:
The FHWA established the CARMA Program in 2014 to “encourage collaborative research on the technology, open source tools, and frameworks poised to improve transportation system mobility, safety, and efficiency. The CARMA Program is leading research on cooperative driving automation (CDA), leveraging emerging capabilities in automation and cooperation to advance transportation systems management and operations (TSMO) strategies.” This slide provides a graphical overview of the CARMA Program. (CARMA Program Overview) Cooperative driving is a natural extension of vehicle connectivity and is envisioned to transform the transportation system, enhancing safety, traffic flow, and operational efficiency.
Slide 18:
ITS JPO Strategic Plan 2020-2025
- Vision
To accelerate the use of ITS to transform the way society moves
- Mission
To lead collaborative and innovative research, development, and implementation of IT to improve the safety and mobility of people and goods
Author’s slide 18 meeting notes below:
USDOT ITS Joint Program Office’s 5-year Strategic Plan 2020-2025 “describes the ITS JPO’s vision, mission, and strategies that will help the U.S. Department of Transportation achieve its key technology research and development priorities and ensure that our nation has the safest, most efficient and modern transportation system in the world.”
Source:
ITSJPO StratPlanFactSheet.pdf (dot.gov)
ITS JPO Strategic Plan 2020-2025 (dot.gov)
Slide 19:
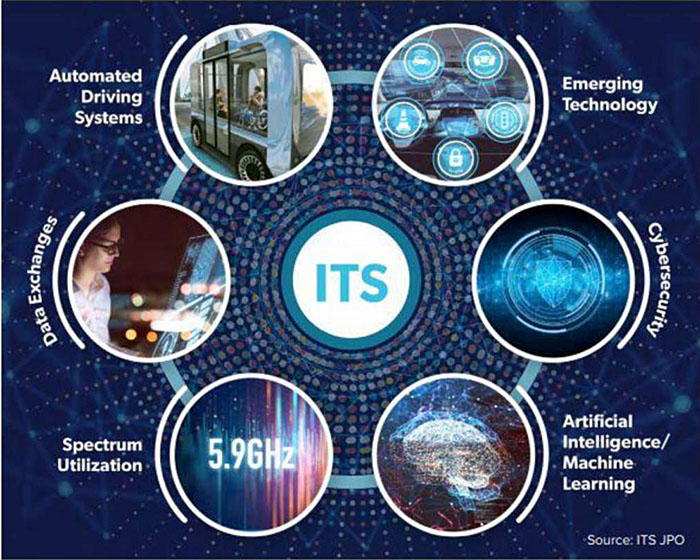
ITS JPO Research Priorities
Author’s slide 19 meeting notes below:
The USDOT ITS JPO Strategic Plan 2020-2025 identified six research areas, as shown below. The Strategic Plan goals, research areas, and technology transfer programs work together to accelerate ITS deployment.
Source:
ITSJPO StratPlanFactSheet.pdf (dot.gov)
Slide 20:
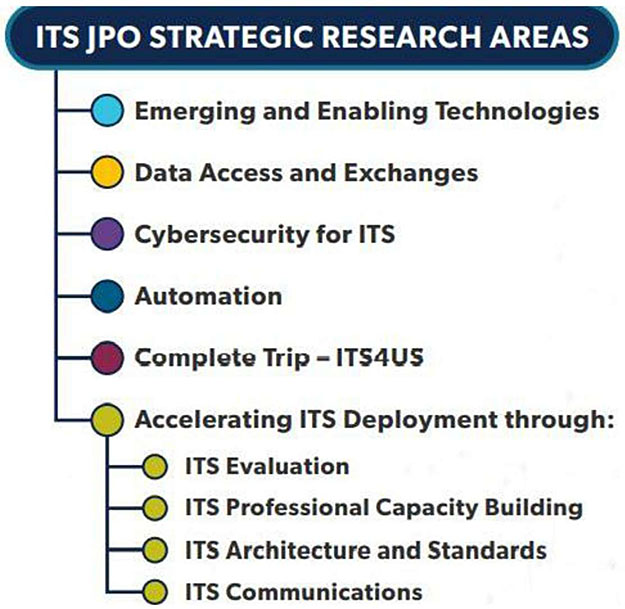
ITS Architecture and Standards
- National ITS Reference Architecture (ARC-IT)
- Guides ITS programs at the national level
- Regional Architecture Development for Intelligent Transportation (RAD-IT)
- Supports regional and project ITS architectures
- Systems Engineering Tool for IT (SET-IT)
- Tool to integrate drawing and database tools with ARC-IT
Author’s slide 20 meeting notes below:
Sources:
ARC IT 9 0 (dot.gov)
RAD-IT (arc-it.net)
SET-IT (arc-it.net)
Slide 21:
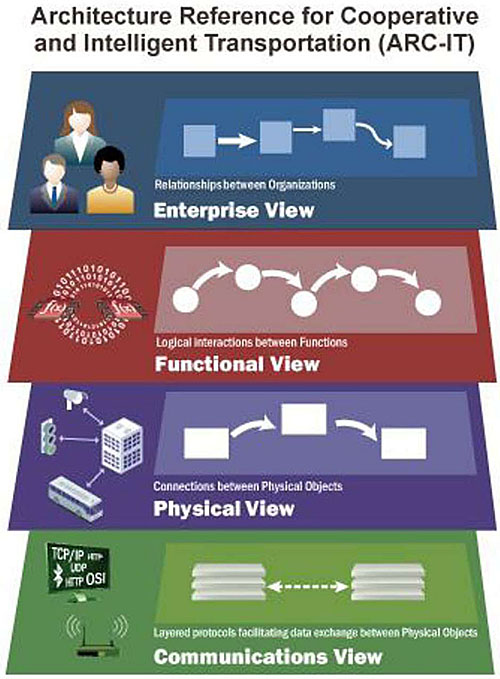
ARC-IT
- Reference architecture that provides common basis for planners and engineers
- Does not mandate any particular implementation
- Provides tools to develop regional architecture
Author’s slide 21 meeting notes below:
Source:
Architecture Reference for Cooperative and Intelligent Transportation (arc-it.net)
Slide 22:
ITS Standards and Architecture
Author’s slide 22 meeting notes below:
The USDOT ITS Standards Program, established in 1996, focuses on interfaces and information exchanges identified in the National ITS Reference Architecture to ensure that development and implementation of the system and system components by Federal, state, and local agencies, as well as private sector developers and vendors, maintain technological compatibility and functional communications. Standards development is supported by the ITS Standards Program of USDOT’s ITS JPO and provides a collaborative process to define and update standards for use by all public and private entities involved in the development of ITS applications and technology. The ITS Standards Program works with standards development organizations (SDOs), such as the American Association of State Highway and
Transportation Officials (AASHTO), the Institute of Transportation Engineers (ITE), the American Public Transportation Association (APTA), Society of Automotive Engineering (SAE) International, and the Institute of Electrical and Electronics Engineers (IEEE), to address interface requirements between different ITS applications.
ITS standards provide the technical guidance and requirements for each component of an ITS system. They guide every aspect of technical applications and system communications, and compliance is required for all applications. Collaboration between a broad range of stakeholders is important to the development of ITS standards and continues through standards management and professional capacity building. Through its Standards Implementation Assistance program, the ITS JPO offers technical assistance, guidance, and training. Initiatives include a web-based, modular ITS Standards training series, available at ITS Professional Capacity Building Program, as part of a larger ITS Professional Capacity Building Program.
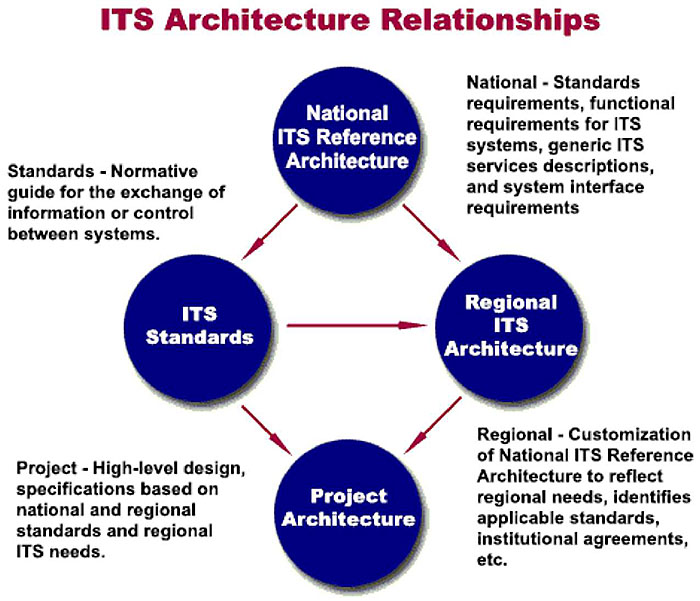
The relationship between the National ITS Reference Architecture, Regional ITS Architecture, ITS Standards, and project architecture is shown in this graphic.
Slide 23:
Growth of ITS Deployment
- ITS deployment is growing rapidly, nationally, and globally
- The global value of the ITS market was estimated over $26 million in 2021
- Projected growth at 7 percent over the next 7 years expected - $42 million by 2028
Author’s slide 23 meeting notes below:
ITS deployment and market share are rapidly growing globally and nationally. According to a market research report published by Grandview Research, the global value of the ITS market was estimated at over $26 billion in 2021, with a projected growth rate of 7 percent from 2021 to 2028, expected to reach $42 billion by 2028. North America currently dominates the ITS market with almost 43 percent of the market in 2020. This is attributed to USDOT investments in research and development, adoption, and deployment efforts. The report notes that advanced traffic management systems (ATMS) accounted for over 30 percent of the market share, and that advanced public transportation system (APTS) is a segment anticipated to show considerable growth over the 2021-2028 forecast period. A study by Global Market Insights found that the ITS market exceeded $40 billion globally with a projected 9 percent compound annual growth rate globally and 12 percent for the U.S. market. (Intelligent Transportation System Market Size Forecasts 2027 (gminsights.com)).
Slide 24:
Areas of Growth in ITS
- Freeway management
- Arterial management
- Incident management
- Transit management
- Future deployment plans
- Connected vehicles and automated vehicles
Author’s slide 24 meeting notes below:
The USDOT ITS JPO published Deployment of Intelligent Transportation Systems: A Summary of the 2016 National Survey Results in March 2018. The tracking survey has been conducted since 1998. The survey targets 108 metropolitan areas and included 849 state and local agencies in the 2016 survey. The survey documented ITS deployment trends in freeway management, arterial management, incident management, transit management, and future deployment plans. Subsequent ITS deployment surveys have focused on connected vehicle and automated vehicle (2019) and small urban and rural transit (2019).
Slide 25:
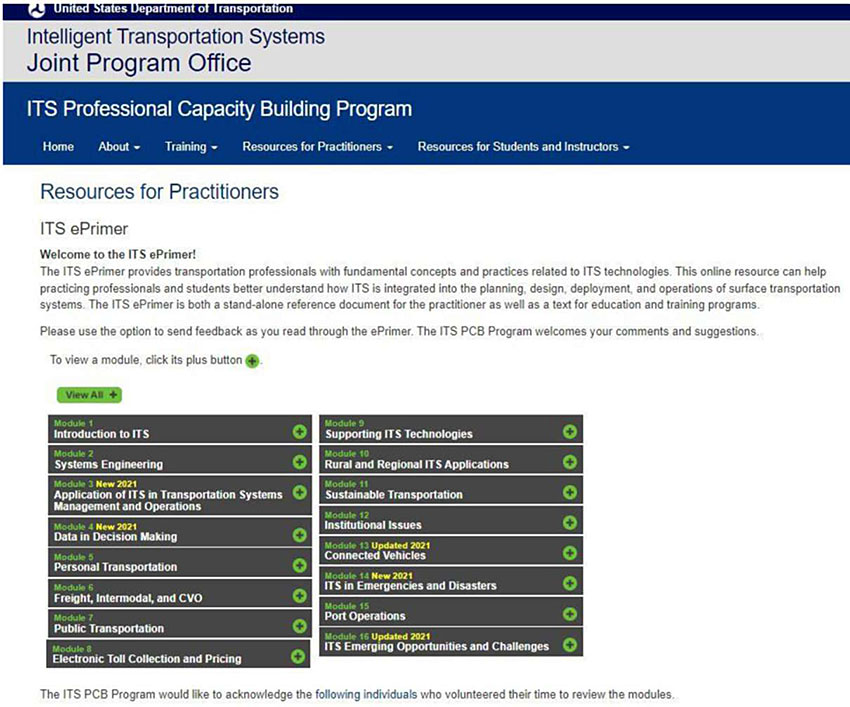
How to Use the ITS ePrimer
- Modules are structured around specific topic areas and intended to stand on their own
- 16 different authors - level of detail varies across modules, and some topics are cross-cutting/overlapping
Author’s slide 25 meeting notes below:
Each module has been developed by subject matter experts and peer reviewed by experts inside and outside the USDOT.
Slide 26:
Content Outline
- Introduction to ITS
Provides an overview of ITS including history, benefits, and future vision
- Systems Engineering
Presents an overview of systems engineering and its relation to ITS architecture, planning, and deployment
- Application of ITS to TSMO
Provides an overview of ITS technology and tools used to manage transportation strategies, systems, and networks
Slide 27:
Content Outline (cont’d)
- ITS Data in Decision Making
Introduces fundamentals related to collecting, storing, analyzing, and sharing ITS data to manage performance and improve decision-making
- ITS to Support Travelers
Focuses on ITS applications to support multimodal transportation: information, safety, convenience
- Freight and Commercial Vehicle ITS
Illustrates and explains major ITS applications related to freight management and commercial vehicle operations
Slide 28:
Content Outline (cont’d)
- Public Transportation
Identifies a broad range of ITS applications in public transportation and describes how they enhance efficiency, convenience, safety, and security
- Electronic Tolling and Pricing
Provides an introduction to electronic payment systems applications and pricing strategies
- Supporting ITS Technologies
Describes various supporting ITS technologies and considers opportunities for deployment and integration
Slide 29:
Content Outline (cont’d)
- Rural and Regional ITS Applications
Identifies unique transportation needs in rural areas and applies lessons from successful ITS deployments in rural and regional settings
- Sustainable Transportation
Explores opportunities to integrate ITS technologies in support of sustainable transportation
- Institutional Issues
Defines institutional challenges encountered in planning, deploying, and maintaining ITS and provides guidance on addressing institutional concerns
Slide 30:
Content Outline (cont’d)
- Connected Vehicles
Examines current and emerging CV technologies and discusses institutional, policy, legal, and funding challenges associated with CV applications
- ITS in Emergencies and Disasters
Provides information on how ITS can support transportation operations during emergencies and disasters
Slide 31:
Content Outline (cont’d)
- Port Operations
Provides an overview of ITS related to port operations and supports expanded port participation in ITS applications
- ITS Emerging Opportunities and Challenges
Explores 4IR technologies and how developments in data, computing, and telecommunications are impacting ITS and transportation profession
Slide 32:
ITS ePrimer Online Products
- Available online
- 16 modules
- PowerPoint slides with speaker notes and suggested audience interaction for each module
Author’s slide 32 meeting notes below:
Key Message:
Slide 33:
Resources
Author’s slide 33 meeting notes below:
You can find more great information at PCB Home. Other resources for ITS information can be found at these sites.
Return to top ↑