← Back to Module 2
ITS ePrimer Presentation
Module 2: Systems Engineering
(Note: The following PowerPoint presentation is a supplement to the module.)
Slide 1: ITS ePrimer Module 2: Systems Engineering

September 2013
Intelligent Transportation Systems Joint Program Office Research and Innovative Technology Administration, USDOT
recomposition Notes for Slide 1:
This is the first, title slide in all modules.
The following slides are in this order:
- Instructor
- Learning Objectives
- Content-related slide(s)
- Summary (what we have learned)
- References
- Questions?
This module is sponsored by the U.S. Department of Transportation's ITS Professional Capacity Building (PCB) Program. The ITS PCB Program is part of the Research and Innovative Technology Administration's ITS Joint Program Office.
Thank you for participating and we hope you find this module helpful.
Slide 2: Instructor
Bruce Eisenhart
Vice President of Operations
Consensus Systems Technologies (ConSysTec)
Centreville, VA, USA
Slide 3: Learning Objectives
- Provide an introduction to the systems engineering process (SEP) and how to apply it to the development of ITS projects
- Provide an overview of intelligent transportation systems (ITS) architectures
- Review the role of ITS standards in the development process
- Discuss the Architecture and Standards Rule and the role of Systems Engineering and ITS Architecture in addressing the requirements of the rule
- Identify how SEP supports transportation planning
Slide 4: Introduction
What is Systems Engineering?
According to the International Council on Systems Engineering (INCOSE) Handbook (2007):
"Systems engineering is an interdisciplinary approach and means to enable the realization of successful systems."
Author Notes for Slide 4:
Key Message: Definition of Systems Engineering (SE)
Source: INCOSE Systems Engineering Handbook, Version 3.1, 2007.
Slide 5: What Is Meant by Interdisciplinary Approach?
- The application of basic engineering discipline, management discipline, and expertise in whatever applications domain the system lies.
- For ITS, the basic engineering discipline is Transportation Engineering.
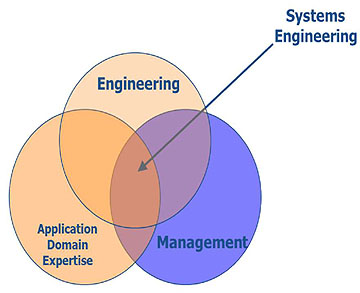
(Extended Text Description: A Venn diagram with three intersecting circles. The top circle has the word "Engineering". The lower left circle has the words "Application Domain Expertise". The lower right circle has the word "Management". There is an arrow pointing to the area of overlap from all three circles and the words "Systems Engineering" in the upper right corner at the end of the arrow.)
Source:
"RITA: National ITS Architecture SE Process Improvement Presentation"
Author Notes for Slide 5:
Key Message: Discusses what is meant by interdisciplinary approach with regard to SE. To successfully develop a system requires the application of basic engineering discipline, management discipline, and expertise in whatever application domain the system lies. In the case of ITS systems, that application domain is transportation engineering. The intersection of these disciplines is the realm of Systems Engineering.
Source: RITA: National ITS Architecture SE Process Improvement Presentation
Slide 6: Key Concepts of Using the SEP
The systems engineering process (SEP) seeks to:
- Consider the entire life cycle of a system
- Focus on stakeholder involvement
- Understand the problem to be addressed
- Address project risks as early as possible
- Clearly document the process and the output of each step
- SEP is scalable based on size, complexity, and risk of project
Author Notes for Slide 6:
Key Message: Lists several key concepts of SEP.
- Consider the entire life cycle of a system. SEP does not just concern itself with the timeline of a project's start to completion; SEP considers planning activities that occur before the project starts. SEP covers steps following initial deployment including operations and maintenance and system retirement or replacement.
- Focus on stakeholder involvement. SEP involves the stakeholder in all steps in the process, from identifying the needs through system validation. Stakeholder involvement is a key to the successful application of SEP.
- Understand the problem to be addressed. View the problem from the stakeholders' point of view by defining needs from the user's perspective.
- Address project risks as early as possible. The earlier a risk is identified and resolved, the less cost and/or schedule impact there will be on the project.
- Clearly document the process and the output of each step. SEP should be tailored to each project—it is not one-size-fits-all. Regarding outputs, stakeholders must review the outputs of each step in the process and make informed decisions about proceeding to the next step.
- SEP is scalable based on the size, complexity, and risk of a project. SEP is definitely not a one-size-fits-all process. It can and should be tailored to fit the needs of the project.
Slide 7: Benefits and Costs of SEP
- Benefits
- Improve the quality of products created by the project
- Reduce the risk of schedule and cost overruns
- Increase the likelihood that user needs will be met
- Improve stakeholder participation
- Provide better documentation
- Reduce operational costs
- Costs
- SEP causes some reapportionment of cost with additional effort needed early in process and during verification
Author Notes for Slide 7:
Key Message: Summarizes benefits of SE and the cost of using the SEP.
Benefits: Systems engineering can improve the quality of the products created by an ITS project, reduce the risk of schedule and cost overruns, and increase the likelihood that the implementation will meet the user's needs. Other benefits include improved stakeholder participation and better documentation of not only the end products, but of the development process itself. Anyone who has tried to pick up a project midstream after a key person unexpectedly leaves will understand the benefit of good documentation during the development effort. In addition, the benefits of using the SEP can continue throughout the life cycle of the system developed through reduced operational costs as a result of implementing the product correctly the first time, thereby reducing the need for later modifications.
Cost: The SEP has several outputs prior to the design phase that require expenditure of resources to complete, but doing this can provide the benefits shown. In general, the use of SEP will result in more effort expended at the early stage of the development process—those steps leading up to detailed design. Additional costs may also be incurred during the systematic verification.
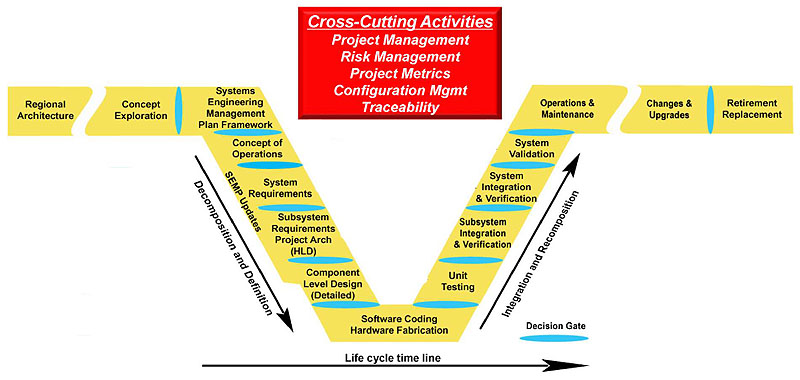
Slide 8: Systems Engineering Model for ITS: The "V"
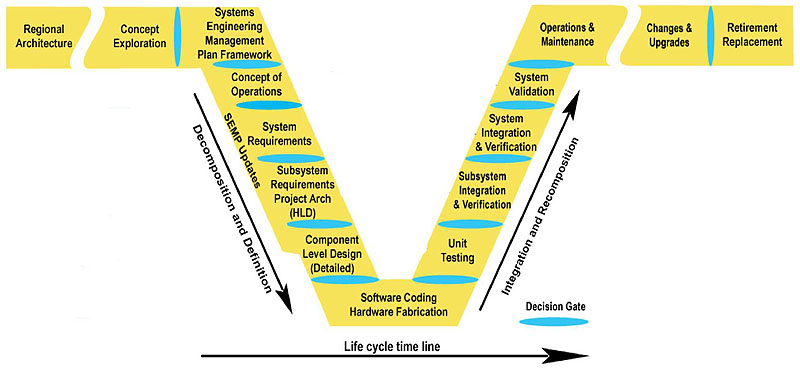
(Extended Text Description: Includes an image that describes the V model of the Systems Engineering Process Life Cycle. The left side of the V represents concept development and the decomposition and definition of requirements into function and physical entities that can be architected, designed, and developed. The right side of the V represents integration and re-composition of these entities (including appropriate testing to verify that they satisfy the requirements) and their ultimate transition into the field, where they are operated and maintained. Each step in the life cycle is delineated by a decision gate. Starting from the left wing of the V and working down the V across the life cycle time line, it is broken into Regional Architecture, Concept Exploration, Systems Engineering Management Plan Framework, Concept of Operations, System Requirements, Subsystem Requirements Project Arch (HLD), Component Level Design and finally Software Coding Hardware Fabrication at the bottom of the V. Working up the V on the right side includes Unit Testing, Subsystem Integration & Verification, System Integration & Verification, System Validation, Operations & Maintenance, Changes & Upgrades and finally Retirement Replacement.)
Source: Systems Engineering Guidebook for ITS, Version 3.0, FHWA and Caltrans, November 2009, www.fhwa.dot.gov/cadiv/segb
Author Notes for Slide 8:
Key Message: Shows the "V" Model defined and used by USDOT
Covers complete life cycle of a system, from project planning through to retirement or replacement
The next set of slides covers the steps of the "V" one slide per step.
Source: Systems Engineering Guidebook for ITS, Version 3.0, FHWA and Caltrans, November 2009, www.fhwa.dot.gov/cadiv/segb/
Slide 9: Regional ITS Architecture
- First step in the SEP, occurring before project initiation
- Consider how the system to be developed is described in the regional ITS architecture
- Regional ITS architecture is the plan for deployment of ITS in the region
- This step identifies how the system fits into the regional plan for ITS
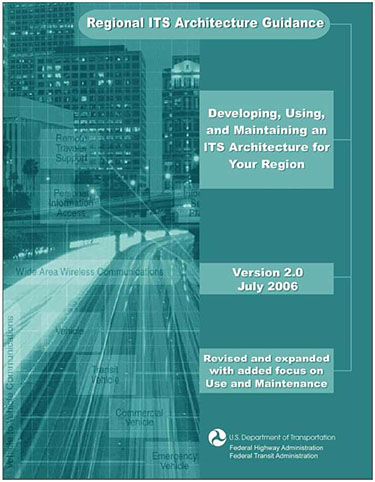
(Extended Text Description: This graphic is the cover artwork for the "Regional ITS Architecture Guidance" document. The cover design features a blue monotone background image on the left side of a time-lapsed freeway going under an overpass with several large urban buildings in the background. There are design elements like a series of flow chart boxes overlaid on the background image of the urban freeway. The subtitle is "Developing, Using, and Maintaining an ITS Architecture for Your Region." Edition text on the right says "Version 2.0 July 2006" and "Revised and expanded with added focus on Use and Maintenance." At the very bottom of the right side is the simple white version of the Department of Transportation logo with the words "U.S. Department of Transportation, Federal Highway Administration, Federal Transit Administration.")
Author Notes for Slide 9:
Key Message: Defines a Regional ITS Architecture
Source: Copy of cover of USDOT Regional ITS Architecture Guidance document
Slide 10: Concept Exploration
- Perform initial feasibility, benefits analysis, or needs assessment
- Evaluate alternative concepts
- Prior to initial investments
- Provide justification for a project to move forward into development
- Make the business case
- Decision gate: Obtain management approval to proceed into the programming of funds phase
Author Notes for Slide 10:
Key Message: Describes the Concept Exploration step, which occurs before project is funded.
The Concept Exploration step in the process is used to perform any initial feasibility, benefits analysis, or needs assessment required to facilitate the planning of the system. This results in a business case and specific cost/benefit analyses for alternative project concepts. The output of this step can be a definition of the problem space, key technical metrics, and refinements to the needs, goals, objectives, and vision. This step provides the justification for the project to move forward into development. This activity may result in combining or dividing candidate projects based on the best cost/benefit analysis. This step has the first of many "decision gates" that show as the light blue ovals between steps in the "V" diagram. These decision gates represent key points in the process where a specific decision is made, based on documented outputs or possibly technical reviews, to advance to the next step in the process.
Slide 11: SE Management Planning
- Development of SE Management Plan (SEMP) for managing the technical effort on a project
- Technical planning and control of the project
- Systems engineering processes to be used for the project.
- 2-stage process
- 1st - SEMP Framework
- Developed at project initiation
- 2nd - SEMP Plan Development
- Developed as project proceeds
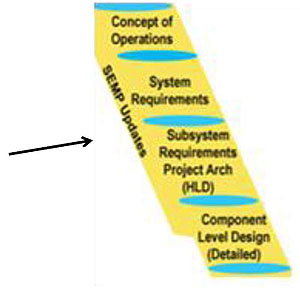
(Extended Text Description: An excerpt of part of the left side of the V Diagram (See slide 8 for more detailed V diagram), including the section from "Concept of Operations" at the top, then "System Requirements," then Subsystem Requirements Project Arch (HLD)" and then at the bottom "Component Level Design (Detailed)." The words "SEMP Updates" appears along the left edge of the diagonal.)
Author Notes for Slide 11:
Key Message: Defines a SEMP and describes the two-stage process.
Framework covers the two sub-bullets under the first bullet. Also defines all the other plans that will be created as part of the 2nd stage.
The SEMP identifies all the required documents and plans that will need to be developed throughout the project. The initial version of the SEMP (sometimes referred to as the SEMP Framework) is developed at the beginning of the project and is usually not a large or complex document as it is basically an outline of what is to come. While the SEMP is a fairly new concept in ITS project development, it is an extremely important tool for managing the technical side of the project. The SEMP is intended to guide the agency or owner of the project in the management of the project. It is not meant to be a document written by the contractor on a project for their own internal management, rather it is the primary tool for the project owner to monitor contractor work and progress.
Source: Portion of "V" diagram
Slide 12: Concept of Operations
- Purpose of the Concept of Operations (ConOps) is to clearly convey a high-level view of the system to be developed that each stakeholder can understand
- Answers who, what, where, when, why, and how about the system from the viewpoint of each stakeholder
- User needs are identified at this stage
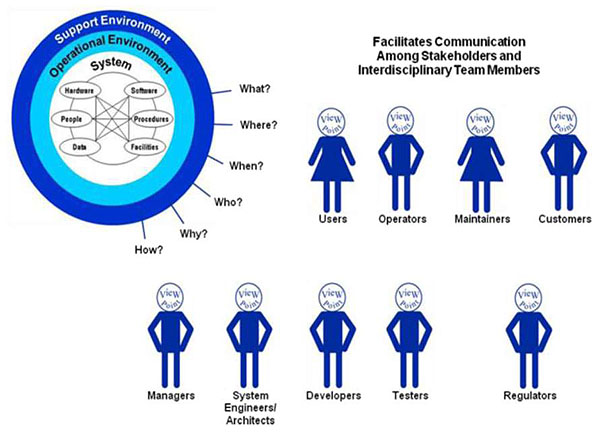
(Extended Text Description: This graphic has a series of images including icons of people standing in a row. In the upper left corner, there is a banded circle graphic with an outer dark blue band with the words "Support Environment." The lighter blue middle band has the words "Operational Environment." The inner white circle has the word "System" at the top, then a series of interconnecting lines. A circle line connects all the text elements (starting at the top left and going counter-clockwise): Hardware, People, Date, Facilities, Procedures and Software. There is a list of question words off the right lower edge of the outer circle: What?, Where?, When?, Who?, Why? and How? To the right of the circular graphic, there are words "Facilities Communication Among Stakeholders and Interdisciplinary Team Members." Under these words are two rows of icons that represent people with viewpoints. The first row of four icons are labeled Users, Operators, Maintainers and Customers. The second row of five icons are labeled Managers, System Engineers/Architects, Developers, Testers and Regulators.)
Used with permission from the American Institute of Aeronautics and Astronautics
Author Notes for Slide 12:
Key Message: ConOps is first key output of the SE process. Defines user needs. Document is written in language stakeholders can understand.
The ConOps stage of the systems engineering process is used to ensure that the system developers document a thorough understanding of the users' needs.
This step embodies several of the key concepts of SEP—engaging the stakeholders (whose input is key to the development of the ConOps), focusing on the problem and user needs, and beginning with the end in mind (i.e., defining key system outputs as well as key operations and maintenance considerations).
Note that for this and all the other SEP documentation—not always created from scratch for each project—you may reuse or update documentation the agency has created for similar types of projects.
Source: Diagram used with permission from the American Institute of Aeronautics and Astronautics from Guide to the Preparation of Operational Concept Documents (ANSI/AIAA G-043A-2012e). This report is based on a cooperative effort between AIAA's Systems Engineering Committee on Standards and the INCOSE Requirements Working Group, providing a systems-level viewpoint and inclusion of international knowledge, information, and experiences that have been recognized since the Guide's original publication.
This edition has been broadened to encompass the development of all system types, including software-intensive systems, and to reflect technological advances of the last two decades. It describes which types of information are most relevant, their purpose, and who should participate in the operational concept development effort. It also provides advice regarding effective procedures for generation of the information and how to document it.
Slide 13: System Requirements
- According to EIA 632, a System Requirement is "something that governs what, how well, and under what conditions a project will achieve a given purpose."
- Types of Requirements
- Functional: define "what"
- Performance: define "how well"
- Non-functional: define "under what conditions"
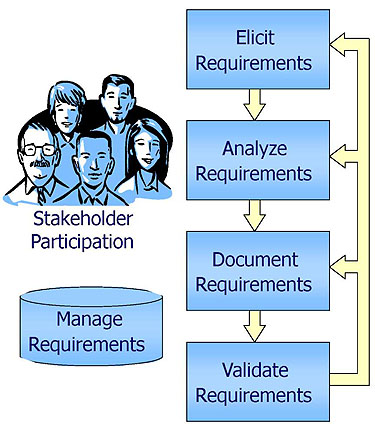
(Extended Text Description: This graphic has on the left an illustration of a group of five people (heads and upper torsos) labeled "Stakeholder Participation" underneath. Directly below is a cylinder labeled "Manage Requirements". To the right is a series of four descending text boxes with arrows directing the flow, from top to bottom, labeled, "Elicit Requirements", "Analyze Requirements", "Document Requirements" and "Validate Requirements." There another arrow that runs from the bottom box and points to each of the previous three boxes.)
Author Notes for Slide 13:
Key Message: Another key output of the SE process. Defines the types of requirements.
Figure shows the process used on a project to develop requirements.
Once developed they must be managed, which relates to the cross cutting activity of Configuration Management, which will be discussed later.
Note that requirements may already exist from similar types of projects within an agency, or in the case of field device deployments, the project may operate off of agency specifications for the devices.
At this step a verification plan is also developed that will describe how the requirements will be verified or tested (as shown on the right side of the "V").
Source: Systems Engineering for ITS—An Introduction for Transportation Professionals, USDOT, September 2006, https://ops.fhwa.dot.gov/publications/seitsguide/seguide.pdf, Fig. 16, p. 34 (hereafter called SEHB)
Slide 14: High Level Design
- Begin definition of problem solution
- Identify Subsystems and key Interfaces
- Allocate requirements to Subsystems
- Create a project level architecture
- Analyze alternative designs
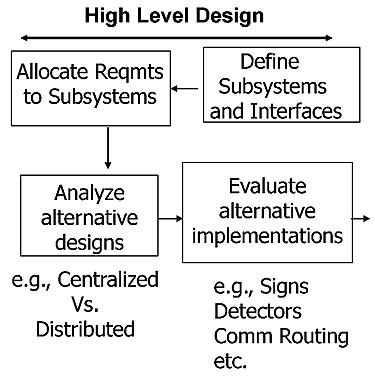
(Extended Text Description: This flow chart is titled "High Level Design" with a line with arrows at both ends pointing in either direction above four boxes of text below. Underneath this at the upper right corner, there is a text box with the words "Define Subsystems and Interfaces," with an arrow pointing to the next box to the upper left that says "Allocate Reqmts to Subsystems" with an arrow pointing to the next box below that says "Analyze Alternative designs" with an arrow point to the next box to the right that says "Evaluate alternative implementations" with an arrow that points off to the right. Under the box that says "Analyze alternative designs" it says "e.g. Centralized Vs. Distributed" and under the box that says "Evaluation alternative implementations" it says "e.g. Signs Detectors Comm Routing." For additional relevant information about this diagram, please see the Author Notes below.)
Author Notes for Slide 14:
Key Message: High Level Design
Up until now we have defined the project without defining the design—here is where we start to define the design.
The key outputs of the High Level Design step are to break the system into subsystems and define the key interfaces between the subsystems. One way to do this is to create a project level architecture for the system. This can be an ITS project architecture or it could be a more detailed view of major components (meaning the subsystems or an additional level of decomposition) and communications links. At this step, the identification of ITS standards is made to support the defined interfaces.
Source: Modification of diagram from National ITS Architecture Team presentation on the "V."
Slide 15: Detailed Design
- Define how the system will be built
- Define components: hardware, software, database elements, firmware, etc.
- Create procurement specifications
- Design any custom hardware or software modules
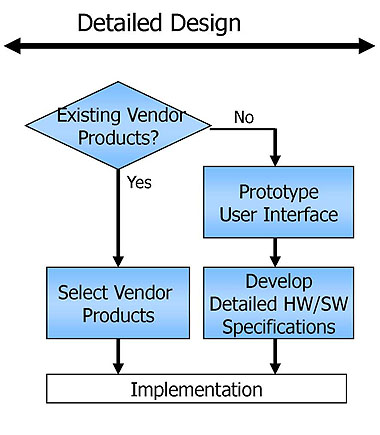
(Extended Text Description: This flow chart is titled "Detailed Design" at the top with a line underneath with two arrows at the end pointing away in either direction, above a flow chart below. On the left, there is a diamond shaped box with the words "Existing Vendor Products?" An arrow labeled "Yes" points down to a rectangular box underneath with the words "Select Vendor Products" with an arrow pointing down to a rectangular box with the word "Implementation" at the bottom. From the diamond shaped box there is also an arrow labeled "No" that points to the right and then down to a rectangular box with the words "Prototype User Interface" with an arrow pointing down to box with the words "Develop Detailed HW/SW Specifications" with an arrow pointing down to the "Implementation" box. For additional relevant information about this diagram, please see the Author Notes below.)
Author Notes for Slide 15:
Key Message: Detailed Design—bullets show some key activities of this step.
Diagram shows a key decision point in step—for each portion of design. Will existing vendor products meet the requirements?
Each subsystem is further defined by components of hardware, software, database elements, firmware, etc. For these components, Detailed Design specialists in the respective fields create documentation (build-to specifications) which will be used to build or procure the individual components. If there is custom hardware or software to be developed, the detailed design of these components or software modules is performed. In practice, most of the hardware used in ITS projects is existing vendor offerings, so little if any hardware design is required. Development of custom software is more common, but even here most ITS projects use vendor software that may be customized for the specific project. This detailed design includes the detailed definition of interfaces, which includes the definition of the communications to be used to link up the various hardware subsystems or components in the project. Included in the interface definition and communications design is the detailed customization of the ITS standards to be used.
Source: SEHB Fig. 21, p. 48.
Slide 16: Procurement/Development
- This step involves hardware fabrication, software coding, database implementation
- Existing Vendor Products are procured and configured
- Concurrently, unit test procedures are developed to demonstrate how well the detailed design is met
- At the end of this step, the system is ready for testing to begin
Author Notes for Slide 16:
Key Message: Describes some key activities of this step.
Procurement is done based on the set of requirements developed, or based on specifications created in detailed design step.
Concurrent with this effort, unit test procedures are developed that will be used to demonstrate how the products will meet the detailed design. At the completion of this stage, the developed products are ready for unit test.
Slide 17: Unit Test
- Hardware and software development are verified against unit verification plan.
- Verify that the delivered components match the documented detailed design.
- For existing vendor hardware/software, perform acceptance testing to show that the hardware and software meet requirements for the unit
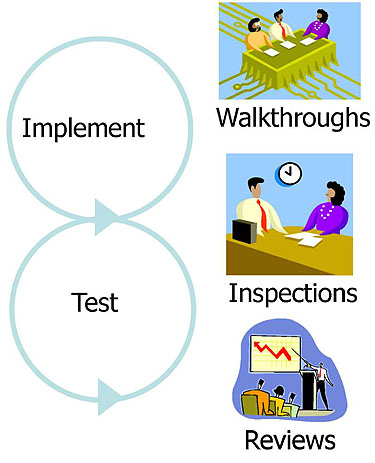
(Extended Text Description: This graphic has a series of illustrations descending on the right side. The first illustration on the upper right side (labeled "Walkthroughs") depicts three people sitting at a table. Each has a sheet of paper in front of them on the table. The second illustration (labeled "Inspections") depicts two people facing each other at a table with some papers on it and a clock in the background. The last illustration (labeled "Reviews") depicts a speaker at a podium in front of an audience, as he shows the audience a chart. On the left side of this series of illustrations are two circles, one above the other and touching tangentially with triangles on the circles acting like arrows. The triangles are both placed at the bottom of each circle and are both pointing to the right. The word "Implement" is in the center of the upper circle and the word "Test" is in the center of the bottom circle.)
Author Notes for Slide 17:
Key Message: The purpose of unit testing is to verify that the delivered components match the documented Detailed Design. In the case of the procurement of COTS existing vendor hardware or software, this unit testing would take the form of acceptance tests that are performed to show that the hardware and software meet the requirements that have been allocated to each unit.
Source: SEHB, Fig. 26, p. 55.
Slide 18: Subsystem Integration and Verification
- Integrate components and verify at the subsystem level using verification procedures
- Verification occurs iteratively. Verify one subsystem before proceeding to the next.
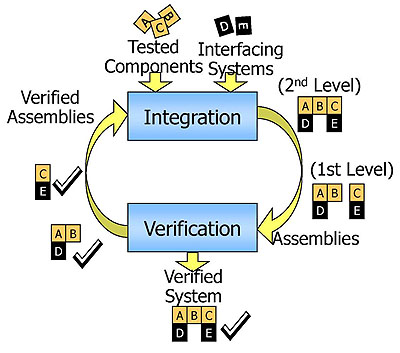
(Extended Text Description: This is a diagram illustrating its iterative flow of subsystem integration and verification. In the center of the diagram are two blue rectangles that are the central steps in this flow. The top rectangle is labeled "Integration". The bottom rectangle is labeled "Verification." Two curved arrows go to and from these blocks two in a clockwise direction. Beginning at the top of the diagram, there are two sets of components that enter the Integration and Verification cycle. The "Tested Components", represented by square icons with the letters A, B, and C, and the "Interfacing Systems" which are represented by square icons D and E. Upon entering the cycle levels of integration appear along the sides of the arrows. Moving clockwise, the first level of assembly integration shows letters A, B and D in a sub-assembly, and next to it, sub-assembly C and E. This passes through the "Verification" point. Moving to the other side of the "Verification" block, each sub-assembly is deemed "verified", and a check mark is placed next to them. They return to the "Integration" block, where the two sub-assemblies goes through a second level of integration to create a complete assembly of A, B, C, D, and E. It goes to the "Verification" block, and is deemed a "Verified System" as noted by the arrow pointing down from the block, and a check mark appears next to the complete assembly. For additional relevant information about this diagram, please see the Author Notes below.)
Source: SEHB, fig. 27, p.60
Author Notes for Slide 18:
Key Message: One of the key features of subsystem integration and verification is its iterative nature. Normally a project will integrate a portion of the system, verify it through testing, then integrate more of the system, verify it through testing, and so on, until the complete system is put together. This would be true for complex system development.
Source: SEHB, Fig. 27, p. 60.
Slide 19: System Verification
- Verification confirms that a product meets its requirements
- Verification ensures that the product is built right
- Two parts to verification:
- Factory Test performed in a controlled environment
- On-site Test Performed in the operating environment, after system deployment
- In all cases, verification procedures are followed
Author Notes for Slide 19:
Key Message: System verification is often done in two parts. The first part is done under a controlled environment (sometimes called a "factory test"). The second part is done within the environment that the system is intended to operate (sometimes called "on-site testing/verification") after initial system deployment. At this stage, the system is verified in accordance with the Verification Plan developed as part of the system-level requirements performed early in the development.
Important to allow sufficient time in schedule for verification—may mean beginning factory tests earlier.
Slide 20: Initial System Deployment
- System is installed in the operational environment
- Transferred from the development team to the team that owns and operates it
- Includes delivery of support equipment, documentation, operator training, and other necessary products to support operations and maintenance of the system
- Perform burn-in or acceptance testing to uncover any issues in operational environment
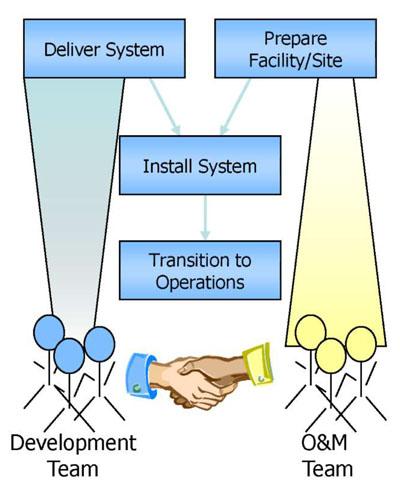
(Extended Text Description: This graphic has two text boxes at the top. On the left, the words "Deliver System" appears in the box and to the right, the words "Prepare Facility/Site" appears in that box. Both boxes have diagonal arrows that point to a middle text box with the words "Install System" in the center, which then points to a box that says "Transitions to Operations." Below, there is an illustration of two shaking hands. Under the "Deliver System" box there is a cone that connects down the bottom of the graphic to a series of three stick figures labeled "Development Team." Under the "Prepare Facility/Site" box, there is cone that connects down to a series of three stick figures labeled "O&M Team".)
Author Notes for Slide 20:
Key Message: System deployment
Key transition from development to operations
Source: SEHB, Fig. 26, p. 66.
Slide 21: System Validation
- In-process and once operational
- At each step are the right outputs defined
- Once Operational was the right system built?
- Validate that the system meets the needs defined in the ConOps
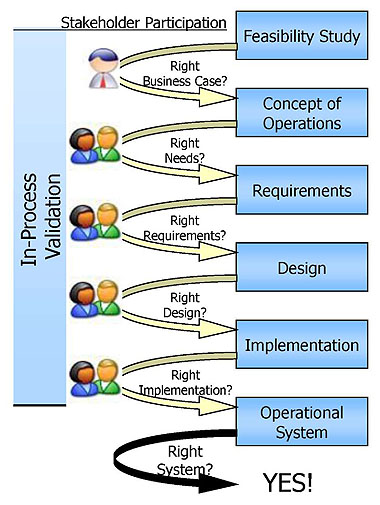
(Extended Text Description: This is a graphical representation of the In-Process Validation and Stakeholder participation as needed in each step to design an operational system from beginning to end in flowchart form. On the far left is a light blue rectangle running vertically down the length of the flowchart labeled "In-Process Validation". At the top of the middle section is the label "Stakeholder Participation". Within this section are avatars of people representing stakeholders in a particular step of the design process. To the far right are six light blue horizontal rectangles. Each rectangle represents a step in the design process. From top to bottom, the boxes read: Feasibility Study, Concept of Operations, Requirements, Design, Implementation, and Operational System. Semi-circular arrows travel from one process step, toward the represented Stakeholders, looping down to the next process step along with important questions that stakeholders must ask. The flowchart reads as follows: From Feasibility study, arrow goes to stakeholder. Stakeholder asks "Right Business Case?", and arrow proceeds to "Concept of Operations. From "Concept of Operations", an arrow goes to stakeholders. Stakeholders ask, "Right Needs?", arrow proceeds to "Requirements". From "Requirements", arrow proceeds to stakeholders. Stakeholders ask "Right Requirements?", arrow proceeds to "Design". From "Design", arrow proceeds to stakeholders. Stakeholders ask "Right Design?", arrow proceeds to "Implementation". From "Implementation", arrow goes to stakeholders. Stakeholders ask "Right Implementation?", arrow proceeds to "Operational System". Flowchart concludes with a black arrow flowing from the "Operational System" rectangle, with the question "Right System?", followed by a large "YES!" in all capital letters.)
Author Notes for Slide 21:
Key Message:
Two aspects to validation:
- At each step in process as shown, and
- Once at end with operational system.
Was the right system built (does it fully address the user’s needs) is the question asked at the end.
Source: SEHB, Fig. 30, p. 71.
Slide 22: Operations and Maintenance
- System carries out intended operations
- Routine maintenance is performed
- Staff is trained
- Longest phase: occurs until system is retired or replaced
Author Notes for Slide 22:
Key Message: In this phase, the system will carry out the intended operations for which it was designed. During this phase, routine maintenance is performed as well as staff training. This phase is the longest phase, extending through the evolution of the system and ends when the system is retired or replaced.
Slide 23: Changes and Upgrades
- Throughout the operations and maintenance process, changes and upgraded may be needed
- Follow the entire SEP and update original outputs as needed
- Following the SEP ensures system integrity is maintained
- SEP may be abbreviated when making changes and upgrades
Author Notes for Slide 23:
Key Message: Changes and upgrades can be addressed by going back to the relevant steps of the "V" diagram and updating the outputs as required. Using the "V" process for changes and upgrades will help maintain system integrity (synchronization between the system components and supporting documentation).
A key aspect of the SEP that will be used as part of changes and upgrades in configuration management—a cross-cutting activity that will be discussed in a few slides.
Slide 24: Retirement and Replacement
- Eventually a system will either no longer be needed, or not be cost-effective to operate
- May not be able to maintain
- e.g., component obsolescence
- Analysis of retirement or replacement may mean implementing a concept exploration step again
- Then begin the full SE process for replacement
Author Notes for Slide 24:
Key Message: In a fitting symmetry to the "V" diagram, this final step is a planning step that can lead back to the beginning of a new project for a system replacement.
Slide 25: Cross-Cutting Activities
- These activities are not associated with any one step of the SE Process, but occur throughout many or all steps
(Extended Text Description: This graphic is an iteration of the standard "V" diagram. See Slide 8 for a complete description. Above this version of the diagram is a large red box. The box is titled Cross-Cutting Activities, followed a list of the following topics: Project Management, Risk Management, Project Metrics, Configuration Management, Traceability.)
Author Notes for Slide 26:
Key Message: Cross-cutting activities begin at the start of the project and can run through into operations.
One slide for each of the activities listed are shown on the following slides. Source: SE Guidebook for V- CCA part of diagram created for this presentation.
Slide 26: Project Management
- Management of cost, schedule, and resources to successfully complete a project
- Closely related to SE; necessary to complete project
- Provides supportive environment to development activities
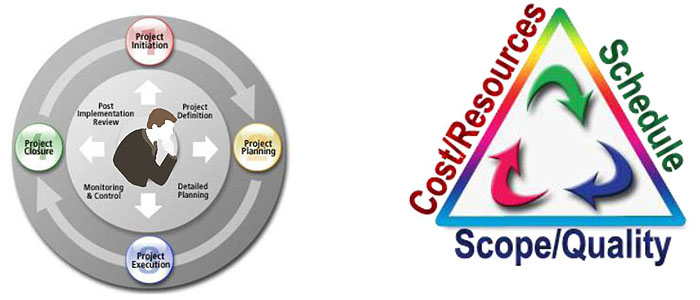
(Extended Text Description: Left: This is a circular diagram illustrating the process cycle of project management. The diagram consists of an outer ring with the phases of Project Management and an inner circle with tactical steps within each phase. In the outer ring, are two large curved arrows indicating that the graph be read in the clockwise direction. Beginning at the top of the circle is a small red circle labeled "1 Project Initiation". Follow the arrows to the right side of the circle's outer ring to a smaller yellow circle labeled "2 Project Planning". Continue following the arrows to the bottom of the ring to get to a small blue circle labeled "3 Project Execution". And finally follow the arrow to the left side of the ring to a small green circle labeled "4 Project Closure". Inside the inner circle is a figure of a man. From the man, there are four arrows, each pointing to the colored rings in the outer ring of the circle. Between each quadrant formed by the arrows are important tactical items that take place during each phase. Between "1 Project Initiation" and "2 Project Planning" is tactical item "Project Definition". Between "2 Project Planning" and "3 Project Execution" is item "Detailed Planning". Between "3 Project Execution" and "4 Project Closure" is item "Monitoring & Control". Between "4 Project Closure" and "1 Project Initiation" is "Post Implementation Review".
Right: In the second graphic on the lower right is a triangular cycle diagram with a red, green, and blue curved arrows pointing at each other head to tail to create a circular loop. The left side of the triangle are the words "Cost/Resources". On the right side of the triangle is written "Schedule" in green. On the bottom of the triangle is "Scope/Quality" written in blue.)
Author Notes for Slide 27:
Key Message: Project management (PM) is a discipline in itself. The diagram on the left shows the key steps of the PM process, while the diagram on the right shows the triangle of constraints that project management seeks to manage.
The system owner or agency has a vested interest in making sure that the development team (usually a contractor team) follows good project management practices, and can require key outputs such as a project management plan and project status reporting as part of the contract deliverables.
Source: National ITS Arch presentation on cross-cutting activities.
Slide 27: Risk Management
- Identify and control risks
- Identify problems before they occur
- Plan for the occurrence, and monitor to take early action when necessary
- Steps
- Risk Identification
- Risk Analysis and Prioritization
- Risk Mitigation
- Risk Monitoring
- Develop and update a risk management plan
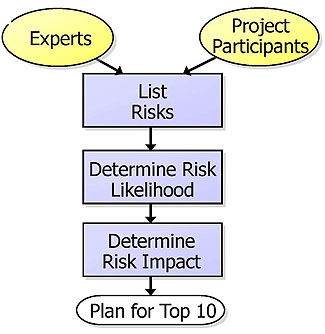
(Extended Text Description: This graphic shows the flow of risk identification and risk analysis/prioritization. At the top of the downward flowing chart are two yellow ovals. The oval on the left is labeled "Experts". The oval on the right is labeled "Project Participants". Each of these ovals has an arrow pointing diagonally down to a common blue rectangle labeled "List Risks". From "List Risks" is an arrow pointing down to a second blue rectangle labeled "Determine Risk Likelihood". From the second blue rectangle is an arrow pointing down to a third blue triangle labeled "Determine Risk Impact". From the third rectangle is a final arrow pointing down to a white oval labeled "Plan for Top 10".)
Author Notes for Slide 27:
Key Message: Identifies key activities of risk management. Diagram shows the flow of risk identification and risk analysis/prioritization
Some items to consider for risk identification include:
- Jurisdiction - does the lead agency have jurisdiction or are there other responsible agencies?
- Software - is there existing and proven software that can be used?
- Interfaces - are new interfaces required or can a project rely on existing interfaces?
- Requirements and procedures - are these well-defined and documented?
- Experience - does the staff have the necessary experience to procure, implement, and operate the project?
Source: National ITS Arch presentation on cross-cutting activities.
Slide 28: Project Metrics
- Measures to track and monitor the project and expected technical performance of the system development effort
- Determine if the project is "on track" from a programmatic (budget/schedule) and technical (SEP activities) standpoint
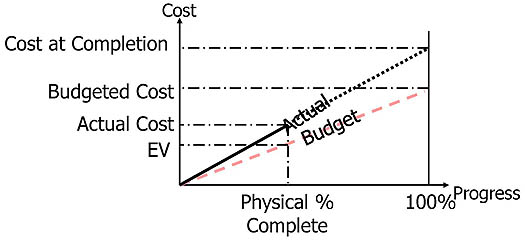
(Extended Text Description: This graph is an example of project metrics. On an xy-plane, they are comparing Progress to the Cost associated with the project. The horizontal X-axis is labeled Progress, with "Physical % Complete" used as the unit of measure. A vertical line is present at the point of project completion labeled at the "100% mark. The Y-axis is labeled Cost with different phases of cost spend used as the unit measure. Starting from the bottom of the Y-axis, A horizontal dotted line is drawn across the graph at each of the following cost metrics starting from the bottom: EV, Actual Cost, Budgeted Cost, and Cost at Completion. There are two diagonal lines that are drawn in the graph beginning at the point where the two axis meet. The first line is a dotted red-line to represent the Budgeted cost. This line extends from where the axis meet to where the point where the budgeted cost and the 100% Progress line intersect. The second line extends from the point where the axis meet to the point where Cost at Completion and 100% Progress meet. This line is above the red line and is labeled Actual. The Actual line begins as a solid black line. A random point of progress has been selected and is depicted with a vertical dotted line and intersects with the EV and Actual Cost. At the point where the Actual line meets the selected point of progress, the Actual line then becomes a dotted line.)
Author Notes for Slide 28:
Key Message: Shows definition and example of project metrics
Project metrics are measures that are used to track and monitor the project and the expected technical performance of the system development effort. The identification and monitoring of metrics allow the team to determine if the project is "on track" both programmatically and technically. Programmatic metrics might be simple budget and schedule status. Technical metrics could involve measuring the number of requirements defined, or the number of requirements changed over a period of time. These metrics are a key part of the project management process.
Slide 29: Configuration Management
- Process to establish and maintain consistency of a product
- Ensures system integrity is maintained
- Components:
- Configuration Management Planning
- Configuration Identification
- Change Management
- Status Accounting
- Process documented in SEMP or Project Management Plan
Author Notes for Slide 29:
Key Message: Shows definition and steps in CM process.
Configuration management is defined as: "A management process for establishing and maintaining consistency of a product's performance, functional, and physical attributes with its requirements, design and operational information throughout its life" (A Guide to the Project Management Body of Knowledge (PMBOK® Guide), 2013). More than just defining the current state of a system, configuration management involves managing changes that are made to the system throughout its life.
Keeping configuration control of documentation as well as hardware/software allows an agency to reuse some of the SE documents for other related projects.
Slide 30: Traceability
- Ensures that different outputs of the SEP process properly relate to each other
- Centers on relationship of requirements to rest of project
- Traceability must work backwards and forwards
- Each need in ConOps traces to a system requirement
- Design specifications trace back to requirements
- Process continues through each stage of SEP.
Author Notes for Slide 30:
Key Message: Key aspect of SEP - key way to ensure quality of outputs.
Slide 31: SEP Summary
- Covers entire life cycle of system
- The process should be scaled for each system/project
- Not one size fits all!
- Small projects use less resources to address key steps or may combine steps
- High-risk projects require more robust SEP
- Define how SEP tailored for each system/project as part of SEMP
Author Notes for Slide 31:
Key Message: Scalability of SEP
The SEP summary provides a final chart to emphasize a key aspect of SEP—the scalability
Slide 32: Related Topics
Other topics that are closely related to the Systems Engineering Process
- ITS Architectures
- National ITS Architecture
- Regional ITS Architectures
- ITS Project Architectures
- ITS Standards
- Applying the SE Process to Project Development
- Transportation Planning
Author Notes for Slide 32:
Key Message: Lists remaining topics of module
Slide 33: National ITS Architecture
- Provides a common framework for planning, defining, and integrating ITS
- The architecture defines:
- The functions that are required for ITS
- The physical entities or subsystems where these functions reside
- The information flows and data flows that connect these functions and physical subsystems
- View at https://www.arc-it.net/
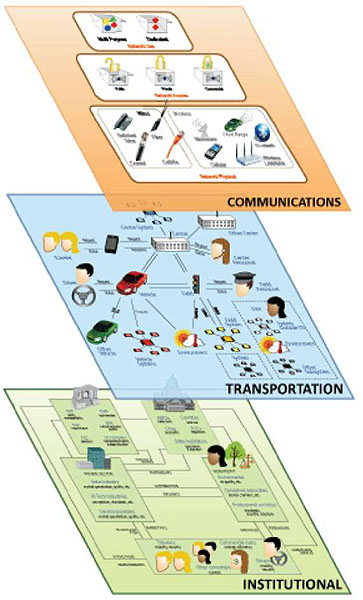
(Extended Text Description: Description from the National ITS Architecture website: this diagram provides a framework for planning, programming, and implementing intelligent transportation systems. It is designed to look like a series of three pages floating and overlapping one another, with illustrations of key concepts on each "page." The architecture framework is comprised of two technical layers, a Transportation Layer (middle, blue background) and a Communication Layer (top, orange background), which must operate in the context of an Institutional Layer (bottom, green background). The Institutional Layer includes the institutions, policies, funding mechanisms, and processes that are required for effective implementation, operation, and maintenance of an intelligent transportation system. The Institutional Layer is shown as the base because solid institutional support and effective decisions are prerequisite to an effective ITS program. This is where the objectives and requirements for ITS are established. The Transportation Layer is where the transportation solutions are defined in terms of the subsystems and interfaces and the underlying functionality and data definitions that are required for each transportation service. This layer is the heart of the National ITS Architecture. The Communications Layer provides for the accurate and timely exchange of information between systems to support the transportation solutions. See additional Author Notes below.)
Author Notes for Slide 33:
Key Message: National ITS Arch
Framework or template for defining arch.
Use the template to develop other types of arch mentioned next.
Diagram illustrates that there are three layers to the National ITS Arch
The current National ITS Arch is Version 7.0
Source: National ITS Arch Web site (URL shown above)
Slide 34: National ITS Architecture
- The physical architecture identifies 22 subsystems (shown below)
- ITS services are described in Service Packages, which represent slices of the architecture
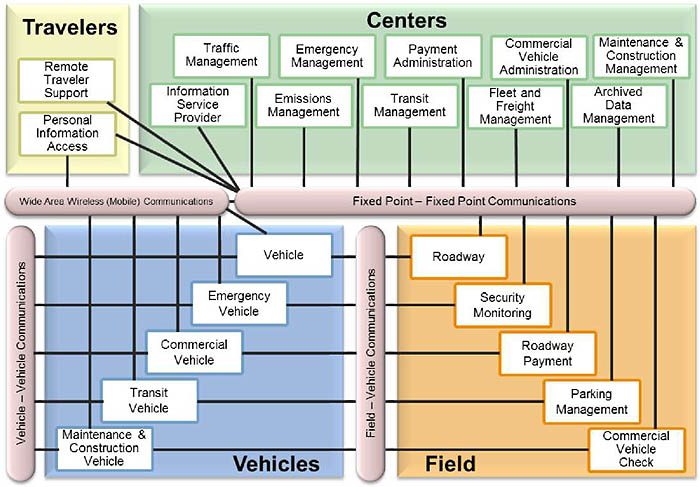
(Extended Text Description: This diagram identifies 22 subsystems of the National ITS Architecture. The diagram is divided into four main sections, with a series of connecting communications formats. In the upper left corner, the Travelers section (yellow background) has two sub-boxes within it: Remote Traveler Support (top, connected by a line to Fixed Point – Fixed Point Communications) and Personal Information Access (bottom, connected by a line to Wide Area Wireless (Mobile) Communications underneath and Fixed Point – Fixed Point Communications underneath and to the right). At the top right, the larger Centers section (green background) has two rows of sub-boxes within it. Top row, left to right: Traffic Management, Emergency Management, Payment Administration, Commercial Vehicle Administration, and Maintenance & Construction Management. Bottom row, left to right: Information Service Provider, Emissions Management, Transit Management, Fleet and Freight Management, and Archived Data Management. Every one of these sub-boxes under Centers is connected by a line to the Fixed Point – Fixed Point Communications box underneath the Centers section and to the right of the Wide Area Wireless (Mobile) Communications box (under Travelers section). To the lower left there is a Vehicles section (blue background) with a set of diagonally ascending sub-boxes within it (start lower left to the upper right of the box): Maintenance & Construction Vehicle, Transit Vehicle, Commercial Vehicle, Emergency Vehicle, and Vehicle. Each of these sub-boxes is connected by a line to the Wide Area Wireless (Mobile) Communications box above it, and to the vertically-running Vehicle-Vehicle Communications box to the left of the Vehicles section. To the lower right, there is a Field section (orange background) with a set of diagonally descending sub-boxes within it (from upper left to lower right): Roadway, Security Monitoring, Roadway Payment, Parking Management, and Commercial Vehicle Check. Each sub-box is connected by a line to the Fixed Point – Fixed Point Communications box above it, and to the vertically-running Field – Vehicle Communications box to the left (in between the Vehicles and Field sections). See Author Notes below for more information. )
Author Notes for Slide 34:
Key Message: Shows key depiction of Physical Arch—the "Sausage diagram"
Source: National ITS Arch Web site: https://www.arc-it.net/
Slide 35: Regional ITS Architectures
- Regional ITS Architectures define the plans, programs, goals, and objectives for implementation of ITS within a more local scope
- Regional specific plan for the deployment and integration of ITS
- Regional ITS Architectures use the National ITS Architecture as a template
- 23 CFR 940.9 defines the nine required elements of a regional ITS architecture
Author Notes for Slide 35:
Key Message: Definition of Regional ITS Arch References the key FHWA Rule/ITS Policy of arch.
Slide 36: Regional ITS Arch - Rule 23 CFR 940.9
The regional ITS architecture shall include, at a minimum:
- A description of the region;
- Identification of participating agencies and other stakeholders;
- An operational concept that identifies the roles and responsibilities of participating agencies and stakeholders;
- Any agreements (existing or new) required for operations,
- System functional requirements;
- Interface requirements and information exchanges with planned and existing systems and subsystems;
- Identification of ITS standards supporting regional and national interoperability; and
- The sequence of projects required for implementation.
Author Notes for Slide 36:
Key Message: Lists Requirements of Rule
Slide 37: Turbo Architecture
- A software tool that automates creation of a Regional/Project ITS Architectures using the National ITS Architecture
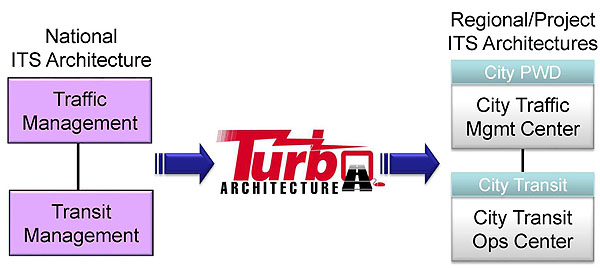
(Extended Text Description: This graphic represents how the Turbo Architecture software can automate the creation of Regional/Project ITS Architectures using the National ITS Architecture. The section on the lower left is labeled "National ITS Architecture". Under this title are two purple rectangles stacked in vertical formation and joined by a black line. The top box is labeled "Traffic Management". The bottom box is labeled "Transit Management". Pointing to the right from this section is a blue arrow pointing to the "Turbo Architecture" logo. From the logo, is another blue arrow pointing to another section on the right titled "Regional/ Project ITS Architectures". Under this section are two blue and white rectangles stacked vertically and joined by a black line. Each blue and white rectangle has a blue rectangle at the top to represent the organization, and a white rectangle below for the internal group responsible for that portion of the project. In the top rectangle in this section, City PWD appears in blue, and City Traffic Mgmt Center appears in white. In the bottom blue and white rectangle, "City Transit" appears in blue, and "City Transit Ops Center" appears in the white section.)
Author Notes for Slide 37:
Key Message: Turbo Architecture will help you use the process to develop a regional ITS architecture.
Turbo is a free download from the National ITS Architecture Web site.
Allows you to personalize and customize the National ITS Architecture for a specific region or project. In this example, we take a general interface between a traffic management subsystem and a transit management subsystem and use that as a template to define the interface between a city PWD and city Transit.
Source: National ITS Architecture training presentation.
Slide 38: ITS Project Architectures
- Provide a high level view of a project focusing on the systems, interfaces, and information flows relevant to the project
- Typical output of the High Level Design step
- Essentially a subset of the Regional ITS Architecture, which is relevant to a specific project; can be used to meet requirements of 23 CFR 940.11
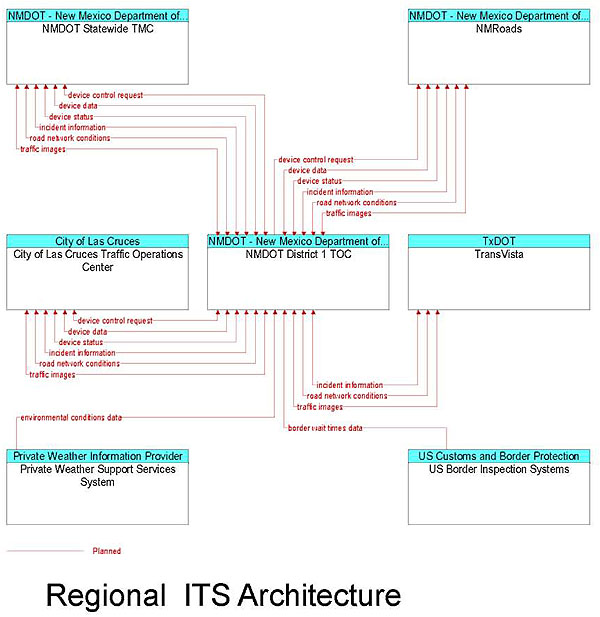
(Extended Text Description: This diagram provides a high level view of a project focusing on the systems, interfaces, and information flows relevant to the project. There are a series of seven main sections with numerous labeled flowchart lines linking the various main sections. At the top left, there is a main section designated "NMDOT – New Mexico Department of… / NMDOT Statewide TMC." There are series of six bi-directional flowchart lines that link this main section to the center middle main section designated "NMDOT – New Mexico Department of… / NMDOT District 1 TOC." The lines are labeled: device control request, device data, device status, incident information, road network connections, and traffic images. At the top right, there is a main section designated "NMDOT – New Mexico Department of… / NMRoads" with a series of six bi-directional flowchart lines linking it to the center middle main section (NMDOT District 1 TOC). The lines are labeled: device control request, device data, device status, incident information, road network conditions, and traffic images. At the middle left, there is a main section designated "City of Las Cruces / City of Las Cruces Traffic Operations Center" with a series of bi-directional flowchart lines linking it to the center middle main section (NMDOT District 1 TOC). The lines are labeled: device control request, device data, device status, incident information, road network conditions, and traffic images. At the middle right, there is a main section designated "TxDOT / TransVista" with a series of three bi-directional flowchart lines linking it to the center middle main section (NMDOT District 1 TOC). The lines are labeled: incident information, road network conditions, and traffic images. At the lower left, there is a main section designated "Private Weather Information Provider / Private Weather Support Services System" with one bi-directional flowchart line linking it to the middle center main section (NMDOT District 1 TOC). The line is labeled: environmental conditions data. At the lower right, there is a main section designated "US Customs and Border Protection / US Border Inspection Systems" with one bi-directional flowchart line linking it to the center middle main section (NMDOT District 1 TOC) with the label: border wait times data. The center middle section is designated "NMDOT – New Mexico Department of… / NMDOT District 1 TOC"). It is linked to all the other main sections via the bi-directional flowchart lines described above. See additional Author Notes below. )
Author Notes for Slide 38:
Key Message: Defines the third type of architecture—project architecture—and gives an example of a project arch drawn from Turbo Arch tool
Requirements of 23 CFR 940.11 will be discussed in a couple of charts.
Source: Regional ITS Architecture. Permission provided by Consensus Systems Technologies.
Slide 39: ITS Standards
- ITS Standards define how ITS systems, products, and components can interconnect, exchange information, and interact to deliver services within a transportation network
- Ensure interoperability between products of different manufacturers
- Types of Standards
- Data transferred on an interface
- Communications protocols used to send data
- Hardware specifications
- More about ITS standards can be found at /stds training.aspx
Author Notes for Slide 39:
Key Message: Definition of ITS Standards—reference to place to get training and info on them.
Slide 40: Using the SEP for ITS Project Development
- SEP is an extension of the traditional project development process, with the same major steps
- Project Initiation
- Preliminary Engineering
- Plans, Specifications, and Estimates
- Construction
- Project Closeout
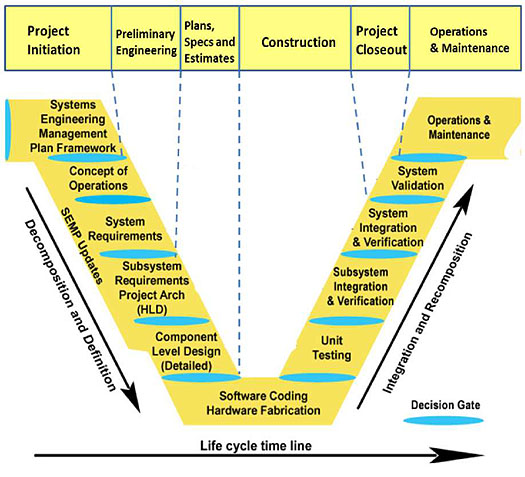
(Extended Text Description: The graphic on this page relates SEP to the traditional transportation development process. The lower portion of the graph is the "V" diagram from SEGB. Please see Slide 8 for a full description of the "V" diagram. Above this version of the graphic is a long yellow rectangle broken up into six sections. Each section represents a stage in project development. Dotted blue lines run vertically down from each section to indicate which project steps fall into each project phase. The sections are grouped as the following: Project Initiation: Systems Engineering Management Plan Framework. Preliminary Engineering: Concept of Operations, System Requirements. Plans, Specs, and Estimates: Subsystem Requirements Project Arch (HLD), Component Level Design (Detailed). Construction: Software Coding hardware Fabrication, Unit Testing, Subsystem Integration & Verification. Project Closeout: System Validation. Operations & Maintenance: Operations & Maintenance.)
Author Notes for Slide 40:
Key Message: Using SEP - relates SEP to traditional transportation development process.
The typical project initiation phase includes activities that occur prior to the start of the project, which includes the procurement process. The impact of SEP on ITS project procurement is described in the document: Model Systems Engineering Documents for Adaptive Signal Control Technology (ASCT) Systems
Source: Bottom "V" from SEGB, top diagram created for this presentation
Slide 41: Systems Engineering Analysis Requirements
- 23 CFR 940.11 defines seven requirements for all projects receiving funding via the Highway Trust Fund.
- Level of detail of the analysis should be commensurate to scope of the project.
- Higher risk projects require a more detailed analysis.
- The federal requirements are closely aligned to the SEP.
Author Notes for Slide 41:
Key Message: Highlights SE analysis requirements of 23 CFR 940.
Slide 42: 23 CFR 940.11 Requirements
The systems engineering analysis shall include, at a minimum:
- Identification of portions of the regional ITS architecture being implemented;
- Identification of participating agencies roles and responsibilities;
- Requirements definitions;
- Analysis of alternative system configurations and technology options to meet requirements;
- Procurement options;
- Identification of applicable ITS standards and testing procedures; and
- Procedures and resources necessary for operations and management of the system.
Author Notes for Slide 42:
Key Message: Defines SE analysis requirements of 23 CFR 940.
Slide 43: Relationship to Transportation Planning
- The outer parts of the SEP "V" Diagram fit within the structure of the transportation planning process.
- Long Range Transportation Plan (LRTP) for a state or MPO contains transportation projects that may be undertaken in the medium or long term.
- Transportation Improvement Program (TIP) contains projects that will be undertaken within four years.
- The Concept Exploration Phase of the SEP can provide input to both the TIP and LRTP.
Author Notes for Slide 43:
Key Message: Reference to how SEP fits into transportation planning
Because ITS systems have life cycles that are often less than 10 years, transportation planning needs to include explicit consideration of technology update or replacement; e.g., as system preservation projects in the Regional ITS Architecture Guidance Document ITS architecture. A more complete discussion of how the regional ITS architecture supports transportation planning can be found in the and in Applying a Regional ITS Architecture to Support Planning for Operations: A Primer.
Slide 44: Summary
- The Systems Engineering Process (SEP) is an approach that manages the entire life cycle of an ITS System.
- The steps of the SEP can be described using the "V" Model.
- Cross-cutting activities occur throughout the SEP.
- ITS Architectures, ITS Standards, and Transportation Planning are all related to the SEP.
- The SEP is used for ITS Project Development to meet Federal requirements.
Slide 45: References
Author Notes for Slide 45:
List publications/Web site links, etc. for additional information on the module topic.
Slide 46: Questions?
- What are the key benefits of using a SEP?
- What are the key contributions of the Concept of Operations and the System Requirements?
- Describe the difference between verification and validation.
- Describe the importance of configuration management and traceability.
- Describe the relationship between a regional ITS architecture and the SEP.
Author Notes for Slide 46:
Answers:
Question 1:
- Improve quality of products created by an ITS project
- Reduce the risk of schedule and cost overruns
- Increase the likelihood that user needs will be met
- Improved stakeholder participation
- Better documentation of the end products and development process
- Reduced operational costs
Question 2:
ConOps defines the system from the perspective of the stakeholder and identifies user needs. System requirements define what the system must do, how well it must do it, and under what conditions.
Question 3:
Verification ensures that a system meets all requirements. Validation ensures that the system meets intended needs. In other words, verification answers "Did I build the system correctly?" and validation answers "Did I build the correct system?"
Question 4:
Configuration Management ensures that all changes are properly documented, to ensure integrity of the system. Traceability ensures proper linkage between each step of the SEP. For example, all user needs are met by requirements, and all requirements meet user needs (forwards and backwards traceability).
Question 5:
The regional ITS architecture is an input to the SEP to provide a high level framework for a project, or project architecture. A project is subset of the regional ITS architecture.
Return to top ↑