← Back to Module 11
ITS ePrimer Presentation
Module 11: Sustainable Transportation
(Note: The following PowerPoint presentation is a supplement to the module.)
Slide 1: ITS ePrimer Module 11: Sustainable Transportation

September 2013
Intelligent Transportation Systems Joint Program Office Research and Innovative Technology Administration, USDOT
Author Notes for Slide 1:
This is the first, title slide in all modules.
The following slides are in this order:
- Instructor
- Learning Objectives
- Content-related slide(s)
- Summary (what we have learned)
- References
- Questions?
This module is sponsored by the U.S. Department of Transportation’s ITS Professional Capacity Building (PCB) Program. The ITS PCB Program is part of the Research and Innovative Technology Administration’s ITS Joint Program Office.
Thank you for participating and we hope you find this module helpful.
Slide 2: Instructor
Louis G. Neudorff, P.E.
Principal Technologist - ITS
CH2M HILL
Virginia Beach, VA, USA
Slide 3: Learning Objectives - To Understand:
- Broad concept of “sustainability”
- Various attributes of a sustainable transportation network
- What “livability” is, and how it is related to and different from sustainability
- The role Transportation Systems Management and Operations (TSMO) and ITS technologies can play in enhancing environmental sustainability
- The role TSMO and the supporting ITS technologies can play in enhancing livability.
Author Notes for Slide 3:
One prerequisite/assumption for this module—that participants already have a working knowledge of the various transportation systems management and operations strategies and ITS technologies that are mentioned herein. These are covered in the other modules.
Slide 4: Learning Objectives (cont.) - To Understand:
- The role TSMO and the supporting ITS technologies can play in enhancing livability
- How other ITS-related technologies and practices (e.g., pricing, in-vehicle devices) can promote reduced emissions
- How TSMO and ITS technologies can be used to help “adapt” to climate change and its impacts
- Potential sustainability and livability-related performance measures
Slide 5: Sustainability
“Meeting the needs of the of the present without compromising the ability of future generations to meet their own needs”
- From the 1987 Brundtland Commission of the United Nations (“sustainable development”)
“Meeting, and sometimes re-defining, the mobility needs of the present without compromising the ability of future generations to meet their needs”
- ITS America Position Statement on ITS and Sustainable Transportation (2012)
In other words: “treating the world as if we intended to stay.”
- Robert Gray, professor at the University of Edinburgh
Author Notes for Slide 5:
Key Message: Most definitions of “sustainability” are based on the UN Brundtland Commission, including the definition adopted by ITS America for sustainable transportation. Simply put, the sound bite version is “treating the world as if we intended to stay.”
Audience Interaction: Perhaps go around and get a sense of how the various participants define “sustainability.”
Slide 6: Sustainable Transportation
“Triple Bottom Line”
- Economic
- Efficient and reliable movement of people & goods
- Social
- Transportation options; safety and security
- Environmental
TSMO and ITS contribute to all three elements
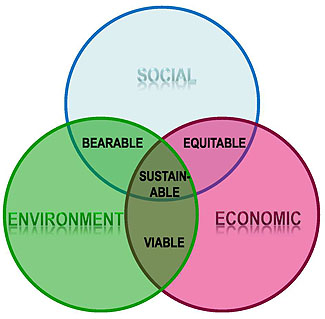
(Extended Text Description: This is a Venn diagram illustrating the “Triple Bottom Line.” This are three intersecting circles in a triangle formation. The top circle labeled “Social” is shaded in blue. The lower left circle is colored green and labeled “Environment.” The lower right circle is colored pink and labeled “Economic.” The right third of the “Environment” circle overlaps with the left third of the “Economic” circle. The upper third area where these two circles overlap also overlap with the lower third area of the “Social” circle above. There are four areas where the circles overlap in varying combinations. On the left side of the overlapping areas, the “Social” and “Environment” circles overlap. This section is a blue-green color and labeled “Bearable.” On the right side of the overlapping areas, the “Social” and “Economic” areas combine. That area is colored purple and labeled “Equitable.” On the bottom of the overlapping areas, the “Environment” circle overlaps with the “Economic” circle. This area is colored brown and labeled “Viable.” In the center of the overlapping areas, all three circles meet, and is also colored brown and labeled “Sustainable.”)
(International Union for Conservation of Nature)
Author Notes for Slide 6:
Key Message: The core of mainstream sustainability thinking focuses on the concept of three dimensions—a “triple bottom line”—addressing environmental, social, and economic considerations. These components of the triple bottom line can be related to the transportation network as shown here. Moreover, TSMO and ITS contributes positively to all three. Other modules address economic and social enhancements from ITS; we will discuss environmental enhancements for ITS later on in this module.
Audience Interaction: This triple bottom line is also known as the “3 Es” (Economic Development, Social Equity, and Environment. (Go to https://bigthink.com/videos/the-three-es for a three-minute video of Professor Joe Sussman of MIT describing the 3 Es from a transportation perspective.)
Slide 7: Livability and Transportation
Livability
“Using the quality, location, and type of transportation facilities and services available to help achieve broader community goals, such as increasing travel choices, improving economic competitiveness, and enhancing unique community characteristics.”
- From The Role of Transportation Systems Management & Operations in Supporting Livability and Sustainability: A Primer - FHWA 2011)
Livable transportation systems accommodate a range of transportation modes (walking, bicycling, public transit, and automobiles).
Author Notes for Slide 7:
Key Message: Another term that is receiving increased attention is that of “Livability.” A definition from a recent FHWA publication is provided here. Sometimes this is also identified as “Complete Streets.”
Livable transportation systems create balanced multimodal transportation networks that offer multiple transportation choices.
Slide 8: Sustainability and Livability
Closely Related - Both:
- Enhance mobility and access
- Address issues of social equity and human health
- Promote more environmentally friendly travel options
Key Differences - Time Frames and Scopes
- Sustainability includes a long-term, multigenerational focus that addresses larger environmental goals.
- Livability initiatives often focus on near-term planning and implementation strategies at the community level.
Author Notes for Slide 8:
Key Message: Sustainability and Livability have common goals in terms of the triple bottom line. That said, there are some key differences with respect to timeframe and geographic focus.
Audience Interaction: Have members of the audience provide what they think are examples of each.
Slide 9: Sustainability and Livability
TSMO and ITS Support Many Key Elements
- Improve transit experience
- Transit signal priority, bus rapid transit
- Support reliable, efficient movement of people & goods
- Incident/work zone management, signal timing, ramp management, managed lanes, active traffic management
- Manage Travel Demand
- Congestion pricing, variable priced tolling
- Provide information to support choices
- Multimodal traveler information
Author Notes for Slide 9:
Key Message: Whatever one might call a proposed transportation improvement— sustainability and/or livability—TSMO and ITS can contribute to achieving both concepts.
Slide 10: Environmental Sustainability and ITS
- Criteria Pollutants
- Greenhouse Gas Emissions
- Potential Impact of Induced Demand
- Eco-driving
- Other Considerations
Author Notes for Slide 10:
Key Message: The rest of this module focuses on several aspects of environmental sustainability in terms of TSMO strategies and ITS technologies.
Slide 11: Criteria Pollutants
National Ambient Air Quality Standards (NAAQS) established for several pollutants
Transportation a major source of some of these
- Carbon Monoxide (CO) - 38%
- Nitrous Oxides (NOx) - 35%
- Volatile Organic Compounds (VOC) - 13%
- Other criteria pollutants include particulate matter (PM), sulfur oxides (SOx), & ammonia
Congestion Mitigation and Air Quality Improvement (CMAQ) program has provided highway funds for projects that reduce emissions & relieve congestion
Author Notes for Slide 11:
Key Message: Let’s start with what is known as “Criteria Pollutants” - including vehicle emissions that are included in the Federal National Ambient Air Quality Standards.
In addition to these criteria pollutants, there are also “Greenhouse Gases” (or GHGs). - Next slide
Slide 12: Greenhouse Gases (GHGs)
Gases That Trap Heat in the Atmosphere
Contribute to Global Warming and Climate Change
- Carbon Dioxide (CO2)
- Methane (CH4)
- Nitrous Oxide (N2O)
- Hydrofluorocarbons
- CO2 - having an atmospheric lifetime of 50 to 100 years - is the most important.
Highway Travel Accounts for Over 25% of GHG Emissions in the U.S.
No Federal Regulations on GHG Emissions
Author Notes for Slide 12:
Key Message: GHGs trap heat in the atmosphere and - according to most scientists - are the primary cause of global warming and climate change.
Emissions from vehicles account for more than 25% of GHG emissions in the United States.
However, unlike the criteria pollutants, there are no federal regulations on GHG emissions (although some state have adopted targets).
Slide 13: GHG and Climate Change
United Nations Intergovernmental Panel on Climate Change (IPCC) - 2007 Report
- Global warming and the associated changes in climate is “unequivocal”
- Increases in global average temperatures since the mid-20th century is “very likely” (i.e., 90%) due to increases in GHG concentrations resulting from human activities
- Based on observed increases in global air and ocean temperatures, widespread melting of snow and ice, and rising global average sea levels
- Of 10 warmest years on record, nine occurred in the past decade (2001 to 2010)
Author Notes for Slide 13:
Key Message: As noted, the vast majority of the scientific community attributes GHGs to a major cause of climate change and global warming.
Regardless of ones’ beliefs on this topic, TSMO and ITS can help reduce both GHG emissions and criteria pollutants. The next few slides summarize some examples.
Audience Interaction: Perhaps ask how audience members feel about the issue of global warming and the attempt to regulate GHGs.
Source: Note - The IPCC will be publishing an update of the 2007 Report in late 2013/early 2014.
Slide 14: Criteria Pollutants - Impact of TSMO/ITS
Some Examples
| Strategy |
Location |
Reduction |
| Traffic Signal Control/Retiming |
Oakland County, MI |
CO: 1.7-2.5%
NOx: 1.9-3.5% |
| Traffic Signal Control/Adaptive |
Toronto, Canada |
All emissions: 3-6% |
| Incident Management |
Atlanta, GA Metro |
CO: 2457 tons
NOx: 262 tons |
| Ramp Control |
Minneapolis, MN |
Net emissions: 1,160 tons |
| Active Traffic Management |
M25 - London Orbital |
All emissions: 2-8%
Noise: 0.7 dB (Livability) |
Author Notes for Slide 14:
Key Message: This slide identifies some examples from the FHWA ITS Benefits Database (www.itskrs.its.dot.gov/benefits), showing reductions from various TSMO strategies.
Also, according to a 2006 FHWA document titled “General Emission Impacts of Transportation System Management Strategies,” TSMO strategies that affect vehicle travel speeds will generally show no effect on PM, SOx, and NH3, and might result in either an increase or decrease in CO, NOx, and VOC depending on the starting vehicle speeds and level of speed change.
Note that noise may also be reduced; and while not a criteria pollutant or GHG, it can impact livability.
Slide 15: Criteria Pollutants and GHG - Impact of Pricing
London Congestion Pricing
Initial Central Zone - Reductions of
- NOx- 8%
- PM10- 6%
- CO2 (GHG) - 16%
Western Extension - Reductions of
- NOx - 2.5%
- PM10 - 4.2%
- CO2 (GHG) - 6.5%
- No longer in operation
(Extended Text Description: This is a photograph of a road in London. There are three vehicles driving forward, down a city street lined with barren trees. The first vehicle is a partially shown four door compact vehicle. The second vehicle is of a black lorry or English taxi. The third vehicle which is further back in the road, is of a dark minivan.)
Source: Transport for London TfL’s Sixth Annual Impacts Monitoring Report
Author Notes for Slide 15:
Key Message: That same 2006 FHWA report also indicates strategies that reduce vehicle miles traveled (VMT), vehicle trips, and vehicle idling that resulted in reduced air pollutants. Congestion pricing—which utilizes vehicle technologies - is one strategy for reducing trips and VMT.
The London Congestion Pricing system has shown major reductions in pollution -both criteria pollutants and CO2 (a GHG).
Slide 16: London Low Emission Zone (LEZ)
Trucks, Buses and Vans Must Meet Euro Emission Standards If Not - Must Pay a Daily Charge to Enter the LEZ
- Vehicles must register
- ALPR installed at all entrances for monitoring
- Despite an overall growth in freight vehicles in London:
- Number of pre-Euro standard trucks has dropped
- PM10 within the LEZ has dropped from 2.46 to 3.07%
- Compared to 1% for other areas around London
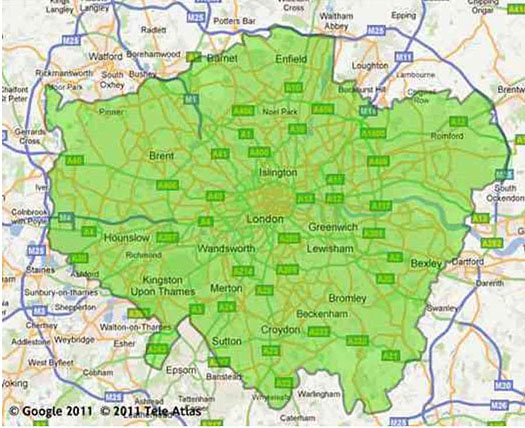
(Extended Text Description: This is a map of the Low Emission Zone in London, England. The area within the London city limits are shaded in green. The LEZ limits extend from Enfield to the north to Sutton in the south, and Hounslow in the west to Romford and Bexley in the east. For additional relevant information about this map, please see the Author Notes below.)
From Transport for London Web site
Author Notes for Slide 16:
Key Message: Transport for London has also initiated a Low Emission Zone around London. All trucks, vans, and buses must register to enter the zone. Any truck, van, or bus that does not meet European standards for vehicle emissions must pay a daily charge to enter the zone.
Automated License Plate Readers (ALPR) are installed at all entrances to zone and record the license plate numbers, which are checked against the database of registered vehicles. If a nonregistered vehicle enters the zone they may be subject to a penalty charge.
As you can see from the information on the slide, the results have been very positive.
Source: More information is available at the TFL Web site -https://tfl.gov.uk/modes/driving/low-emission-zone?cid=pp024
Slide 17: Reducing Transportation GHG Emissions
“4-Legged Stool”
- Improve vehicle fuel economy
- Reduce carbon content of the fuel
- Reduce amount of driving (VMT)
- Pricing
- Land use policies
- Improve operational efficiency of transportation network
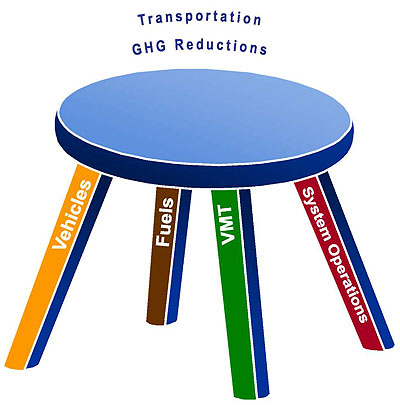
(Extended Text Description: This is a visual representation of the “4-Legged Stool” for Transportation GHG Emissions. At the top of the image is the seat of the stool in blue. Above the seat, is the title “Transportation GHG Reductions.” Below the blue seat, are four 3-dimensional rectangular spokes that make up the “legs” of the stool. Starting on the left is a longer rectangle in yellow representing a front leg of the stool labeled “Vehicles.” To its right is a shorter brown rectangle representing a rear leg labeled “Fuels.” Next, to the right of the “Fuels” leg is a longer green rectangle representing a second front leg labeled “VMT.” And the final rectangle on the right in the rear leg position is red and labeled “System Operations.” For additional relevant information regarding this graphic, please see the Author Notes below.)
Author Notes for Slide 17:
Key Message: Reducing Transportation GHG emissions is often compared to a four-legged stool. These include:
- Improving fuel economy (as the amount of fossil fuel burned is directly related to GHG emissions). The CAFE standards (Corporate Average Fuel Economy) were increased in 2012 - an average 35.5 miles per gallon for vehicle fleets in 2016, and an average of 54.5 miles per gallon in 2025.
- Reducing the carbon content of the fuel used, such as by using electric vehicles (although one should consider the source of the electrical power used to charge these vehicles and the associated GHG).
- Reducing the amount of driving, as previously discussed with the London Congestion Pricing example.
- Improving the operational efficiency of the transportation network via TSMO and ITS.
Slide 18: TSMO Strategies and GHG Emissions
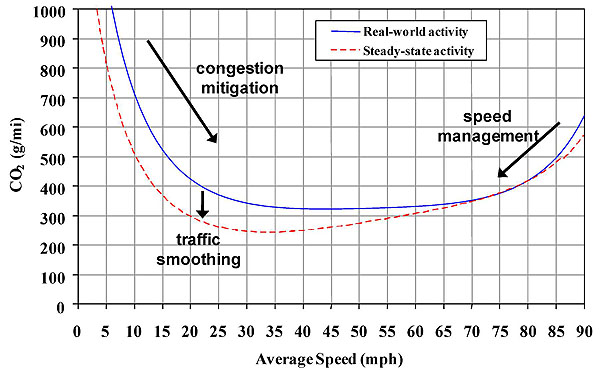
(Extended Text Description: This graph represents speed-based CO2 emissions as compared to the average speed a vehicle is traveling in miles per hour. The horizontal x-axis at the bottom of the graph is labeled “Average Speed (mph).” Units are marked from 0 to 90 in intervals of 5 miles per hour. The vertical y-axis is labeled “CO2 (g/mi).” Units along this axis go from 0 to 1000 in intervals of 100. At the upper right of the graph is the graph legend. There are two items in the legend. The first item shows a horizontal blue line with the words “Real-world activity” written to its right. Below that item is a horizontal dashed red line. To the right of this line are the words “Steady-state activity.” On the graph the solid blue curve is the speed-based CO2 emissions curve for a typical vehicle traveling. This line starts at the 1000 g/mi of CO2 at just over 5 miles per hour, curves downward and plateaus at 35 miles per hour just above the 300 g/mi CO2 line, and continues on that level until it begins to rise again at the 65 miles per hour mark until it reaches the 90 mile per hour mark just above the 600 g/mi CO2 mark. Below the blue line is a the dashed red line, which is the approximate lower bound of CO2 emissions for vehicles traveling at constant steady-state speeds as a result of improved traffic operations. This line begins just before 5 miles per hour at 1000 g/mi mark and travels in a downward curve until it reaches its lowest point at the 30 miles per hour mark at between the 200 and 300 g/mi CO2 level. It then begins to rise again, overlaps with the solid blue line and then separates again until it reaches the 90 mile per hour mark just below the 600 g/mi CO2 line. As the blue and dashed red curves go on their initial downward trajectory, to the right of the blue line, there is black arrow pointing downwards and to the right labeled “congestion mitigation.” As the blue and dashed red lines begin to level out at the bottom of the curve, there is a black arrow pointing straight down from the blue line to the red line labeled “traffic smoothing.” As the curves rise again from the 75 to 85 miles per hour mark, there is a black arrow pointing down and to the left labeled “speed management.” For additional relevant information regarding this graph, please see the Author Notes below.)
(Graph developed by Barth and Boriboonsomsin: University of California at Riverside)
Author Notes for Slide 18:
Key Message: Example: speed-based CO2 emissions curve for a typical vehicle traveling on a highway section (solid blue line); while the dashed red line represents the approximate lower bound of CO2 emissions for vehicles traveling at constant steady-state speeds as a result of improved traffic operations, including:
- Congestion mitigation strategies that reduce severe congestion such that higher average traffic speeds are achieved
- Traffic flow smoothing techniques that can harmonize speeds and suppress shock waves, thus reducing the number of acceleration and deceleration events
- Speed management techniques that can bring down excessive speeds to more moderate speeds of approximately 55 mph
Source: Developed by Matthew Barth and Kanok Boriboonsomsin, from the Center for Environmental Research and Technology (CERT, University of California at Riverside)
Slide 19: TSMO Strategies and GHG Emissions
Congestion Mitigation Strategies
- Incident Management
- Ramp Management
- Hard Shoulder Running
Traffic Smoothing
- Active Traffic Management (Variable Speed Limits/ Dynamic Lane Assignment)
- Traffic Signal Coordination
Speed Management
- Automated Speed Enforcement
Author Notes for Slide 19:
Key Message: Examples of strategies that correspond to improved traffic operations from the previous slide.
The next few slides provide some specific examples.
Slide 20: TSMO Strategies and GHG Emissions
Traffic Signal Coordination
- The National Traffic Signal Report Card (NTOC)
- By achieving an “excellent” rating, traffic signal management could achieve annual savings of nearly 150 million tons of CO2.
- 11.5% of highway GHG emissions nationwide
- Portland, Oregon - Funding from the Climate Trust to improve signal timing on 17 major arterials.
- Climate Trust paid Portland based upon the amount of carbon dioxide emissions that will be avoided.
- Stockholm Adaptive Signal Control System
- 2900 tons of CO2 saved annually
- Very low cost per kg of CO2 saved
Author Notes for Slide 20:
Key Message: Self-explanatory
Note: NTOC = National Transportation Operations Coalition
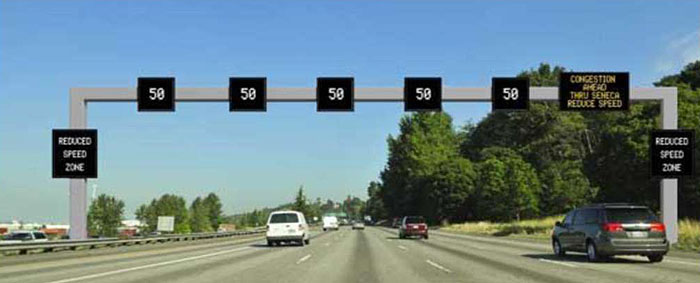
Slide 21: TSMO Strategies and GHG Emissions
Active Traffic Management / Variable Speed
- Managed Motorways in UK - Emissions have been reduced by up to 10%
- Research by UCal Riverside - smoothing traffic flow during congested conditions can reduce fuel consumption and C02 emissions by 10-20%
- Minimal change in travel time
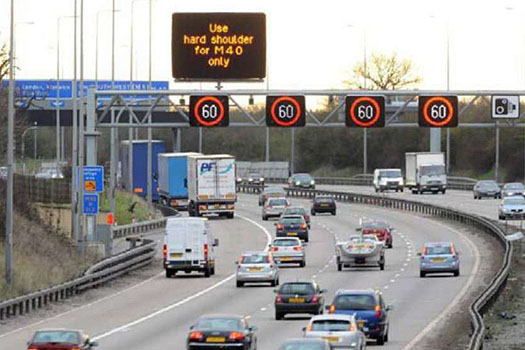
Author Notes for Slide 21:
Key Message: Self-explanatory
Note - The ability to reduce emissions with minimal change in travel times may be an important consideration from the perspective of potential induced demand as discussed next.
Source: Courtesy of Washington State Department of Transportation
Slide 22: Induced Demand
The additional travel that occurs as a result of lowering the generalized cost of travel
Travel time is the primary element of the generalized cost
- Some in the environmental community equate improved operations from ITS with increasing road capacity
- Moving Cooler assumed this in its analysis of ITS
- Resulted in an average offset of 63 to 74% of the cumulative GHG reductions over time from TSMO / ITS
- Other studies infer that while there is some induced demand from improved operations, it is not nearly as large as actually adding capacity
- Potential issue for “carbon offsets” in cap and trade
Author Notes for Slide 22:
Key Message: The issue of induced demand is a very complex one. Most ITS practitioners will tell you that improved operations is not the same as increased capacity—that TSMO and ITS promote a more efficient use of the existing capacity, maximizing the potential throughput of the infrastructure (as defined by the facility’s capacity).
Most of the research on induced demand has been based the effects of new transportation capacity (e.g., expanding existing roads or constructing new facilities). More research is needed in this area focusing on TSMO and improved operations.
Audience Interaction: Perhaps a discussion in the context of short-term and long-term impacts of induced demand, where short term represents an immediate increase in traffic due to reduced costs, and long term represents additional trips resulting from new developments taking advantage of increased accessibility (as is often seen with a new roadway).
Another discussion point - “Cause and effect” - might traffic growth induce road investments every bit as much as vice-versa? In other words, does capacity expansion induce VMT, or does VMT growth cause more lane miles to be built? Some great quotes in this regard to start the discussion:
“Widening roads to ease congestion is like trying to cure obesity by loosening your belt” (Roy Kienitz, executive director of the Surface Transportation Policy Project)
“Increasing highway capacity is equivalent to giving bigger shoes to growing children” (Robert Dunphy of the Urban Land Institute)
Some additional resources:
- Eno Foundation, Working Together to Address Induced Demand, 2002.
- Litman, Todd, Generated Traffic and Induced Travel; Implications for Transport Planning, Victoria Transport Policy Institute, February 2009.
- Neudorff, Louis, Induced Demand from ITS-Based Operational Improvements: Issues and Some Thoughts - Final Draft, Prepared for ITS America.
Slide 23: Eco-Driving
Changing driving behavior and vehicle maintenance to impact fuel consumption and GHG emissions
- Anticipate traffic flow (act rather than react)
- Avoid rapid starts and stops (accelerate and brake smoothly)
- Maintain an optimum highway speed for good mileage
- Ride the “green wave”
- Use cruise control
- Navigate to reduce carbon dioxide
- Avoid short trips
- Avoid excess idling (turn off engine when stopped)
- Minimize A/C use
- Buy an automated pass for toll roads
- Keep tires properly inflated
- Obey your “check engine” light (regular service and maintenance)
- Remove excess weight
- Streamline vehicle’s aerodynamics
Author Notes for Slide 23:
Key Message: Another growing movement to reduce emissions (ECOlogy) and reduce costs (ECOnomy)
This list is a summary from multiple sources on best practices for eco-driving.
Slide 24: Eco-Driving - Education Programs
- Widely used in Europe
- Promoting eco-driving via public education and Internet-based information dissemination now gaining attention in the U.S.
- Costs little to implement
- UCal Berkeley studies on effectiveness of static eco-driving web-based information
- 57% increased their eco-driving score
- Altering driving behavior may be easier than better maintenance practices
- TSMO/ITS can help promote eco-driving
Author Notes for Slide 24:
Key Message: Eco-driving is often discussed with a driver education focus, with UCal Berkeley playing a major role. That said, if you look back at the previous slide on the best practices, TSMO and ITS can also help promote eco driving.
For example - next slide
Slide 25: Eco-Driving - TSMO/ITS
- Anticipate traffic flow
- Major objective of real-time en route traveler information and dynamic lane assignment
- Maintain optimum highway speed
- Goal of variable speed limits
- Ride the “green wave”
- Navigate to reduce CO2
- In-vehicle navigation systems and displays
Author Notes for Slide 25:
Key Message: Examples of how ITS and TSMO can support eco-driving and changed driver behavior.
Slide 26: Climate Change Adaptation
| Climate Change |
Potential Impacts |
| Increase in Very Hot Days |
- Increased number of wildfires (visibility)
- Concerns with pavement / joint integrity
- Construction & maintenance activities
|
| Rising Sea Levels & Surges |
- More frequent inundation of coastal roads
- Erosion of road base
|
| Increase in Intense Precipitation Events |
- Increases in weather-related incidents
- More frequent / severe flooding of low-lying infrastructure
- Scouring of bridge foundations
|
| More Frequent Severe Hurricanes |
- Increased flooding
- More frequent / more extensive evacuations
|
Author Notes for Slide 26:
Key Message: As previously discussed, most scientists have concluded that climate change is upon us, resulting in a number of weather issues as shown in the left column, and their potential impacts on the transportation network.
The transportation network (and other systems) must therefore be prepared to “adapt” to such severe weather conditions. Regional MPOs and state and local departments of transportation (DOTs) will need to consider appropriate near-term operational approaches and long-term planning processes to adapt to the changes in the transportation network resulting from global warming, and to minimize the potential impacts on the transportation system from climatic changes, either through decreasing the system’s vulnerability, increasing its resilience, or some combination.
Source: Table from Transportation Research Board, Special Report 290: Potential Impacts of Climate Change on U.S. Transportation, 2008.
Slide 27: TSMO/ITS in Support of Adaptation
| Operational Condition |
Supporting TSMO/ITS |
| Hot Days (buckling pavements, cars overheating) |
- ATM (variable speed limits)
- Incident management
- Work zone management
|
| Rising Sea Levels |
- Traveler information
- Roadway/transit diversions
|
| Increased Number/Intensity of Precipitation Events |
- ATM (variable speed limits)
- Incident management
|
| Increased Hurricane Frequency |
- Contra-flow operations
- Ramp management/closures
- Integrated Corridor Management along evacuation/re-entry routes
|
Author Notes for Slide 27:
Key Message: TSMO and ITS can help support climate change adaptation for a variety of climate change-related operational conditions as shown on this slide.
Slide 28: Adaptation - Other Considerations
- Communications among all involved agencies
- Transportation, enforcement, emergency management, Homeland Security
- Before, during and after
- Data collection
- Environmental sensors/RWIS
- Keeping ITS operational during and especially AFTER severe weather events
- Backup power
- Remote servers
Author Notes for Slide 28:
Key Message: Lessons learned from Superstorm Sandy in the NJ and NY area identified other adaptation considerations as listed here:
- Maintaining communications among all entities
- Data collection infrastructure to monitor the conditions of the transportation network
- Keeping ITS operational during the event, and especially immediately after severe weather events when persons who had to evacuate can get back to their residences, and to accommodate commuters when some transportation facilities are still closed due to storm damage
Note: RWIS = Road Weather Information System
Slide 29: Sustainability - Performance Measures
“Sustainability is the next great game in transportation. The game becomes serious when you keep score”
MAP-21 Addresses Performance Measures
- Goals to be established for environmental sustainability (along with other areas)
- USDOT to develop performance measures with states, MPOs, transit agencies, and stakeholders
- FHWA to promulgate rulemaking, establishing performance measures and standards by April 1, 2014
Author Notes for Slide 29:
Key Message: MAP-21 specifically addresses the need for performance measures. Goals and measures are to be required for several areas, including environmental sustainability. (Other areas include safety, infrastructure condition, congestion reduction, system reliability, freight movement and economic vitality, and reduced project delivery delays.)
Slide 30: One Sustainability “Scorecard”
The FHWA Infrastructure Voluntary Evaluation Sustainability Tool (INVEST)
Web-based, self-evaluation: www.sustainablehighways.org
- Learn about sustainability principles and the FHWA Sustainable Highways Initiative
- Browse sustainable highway best practices and criteria
- Evaluate or score projects
- 60 criteria organized by module
- System Planning (SP)
- Project Development (PD)
- Operations & Maintenance (OM)
Author Notes for Slide 30:
Key Message: FHWA has recently developed a sustainability scorecard—the Infrastructure Voluntary Evaluation Sustainability Tool (INVEST)
INVEST is a web-based, self-evaluation tool (available at www.sustainablehighways.org) that helps transportation professionals (refer to bullets).
INVEST includes a manual of goals and criteria addressing the full lifecycle of a project, including System Planning (SP), Project Development (PD), Operations and Maintenance (OM).
Source: A multimedia tutorial provided at http://mp125118.cdn.mediaplatform.com/125118/wc/mp/4000/5592/5599/18858/Archive/default.htm?ivt=%7B6d0eccff-4ff1-bba1-c102-d80de1a4a7f5%7D - content is no longer available.
Slide 31: TSMO/ITS - Related Criteria in INVEST
- Travel Demand Management (TDM)
- Implementing TDM strategies (e.g., pricing, transportation management organization)
- Transportation Systems Management and Operations (TSMO)
- Developing a TSMO plan and incorporating them into the Long-Range Transportation Plan
- ITS for System Operations
- Implementation of one or more applications (e.g., emergency management, traveler information, communications backbone, lane management (e.g., variable speed limits and lane assignment via ATM), road weather management, surveillance, traffic signal control, incident management)
Author Notes for Slide 31:
Key Message: Each criterion describes a particular practice, provides methods for implementing it, and includes typical sources of documentation of practices. Several of the criteria are directly related to TSMO strategies and ITS technologies as described in the ePrimer. For example (refer to bullets; continued on the next slide).
Slide 32: TSMO/ITS - Related Criteria in INVEST
- Energy Efficiency
- Energy consumption of lighting fixtures and ITS devices
- Traffic Control Infrastructure Maintenance
- Preservation and maintenance of permanent traffic control, ITS, and safety devices.
- Road Weather Management Program
- Program that includes strategies to mitigate the impacts of various weather scenarios (i.e., adaptation plans)
- Transportation Management and Operations
- Preservation and maintenance of permanent traffic control and ITS devices and systems. Encourage active management of vehicles within the existing roadway infrastructure to alleviate the major causes of congestion.
Slide 33: Other Potential Performance Measures
Environmental Sustainability and Livability
- Emissions of criteria pollutants
- Emissions of greenhouse gases
- Traffic noise levels
- Fuel consumption
- Portion of destinations accessible by multiple modes (and extent to which operation is coordinated)
- Portion of destinations accessible by persons with disabilities or low income
- Portion of travel by walking or cycling
- Traveler assault (crime) rates
Issue of Data Collection for These Measures
Author Notes for Slide 33:
Key Message: Other potential performance measures related to sustainable transportation and livability are listed here.
Audience Interaction: Discuss data collection needs for these measures. This leads into the next discussion on AERIS program (and collecting environmental data)
Slide 34: Connected Vehicles
Applications for the Environment: Real-Time Information Synthesis (AERIS)
- Generate and acquire environmentally relevant real-time transportation data
- Use these data to support and facilitate “green” transportation choices
- Define how connected vehicle data and applications can contribute to mitigating negative environmental impacts of surface transportation
Author Notes for Slide 34:
Key Message: Collecting data on vehicle emissions can be problematic. Criteria pollutants are monitored through a wide network of State and Local Ambient Monitoring Stations (SLAMS) and other networks, all under EPA oversight.
Monitoring GHG levels - particularly carbon dioxide and the extent to which TSMO impacts CO2 levels - is very difficult; but this may be changing, thanks to the AERIS program, part of the USDOT “Connected Vehicles” initiative. This slides lists the AERIS research objectives.
The objectives of the AERIS research program are included on this slide.
Slide 35: Potential Uses of AERIS-Related Data
- Performance measures
- Driver feedback (in real time) to promote eco-driving practices
- Dynamic low emission zones including variable boundaries
- Variable pricing based on real-time cumulative emissions in an area
- Changing TSMO parameters in real time (e.g., signal timing, variable speed displays, ramp metering rates, Integrated Corridor Management strategies) based on real-time emissions data
Author Notes for Slide 35:
Key Message: Having vehicle emissions data in real time offers many exciting prospects for how the transportation network might be managed and operated. This slide shows some potential examples.
Audience Interaction: Any additional ideas as to how real-time emissions data might be used.
Slide 36: Summary
Transportation Systems Management and Operations (TSMO) strategies and supporting ITS technologies have an important role in promoting a sustainable transportation network
- Economic sustainability
- Social sustainability
- Environmental sustainability
- Criteria pollutants and greenhouse gas emissions
Also supports:
- Livability principles
- Eco-driving approaches
- Climate change adaptation measures
Author Notes for Slide 36:
Key Message: TSMO and the supporting ITS technologies can support all three attributes of a sustainable transportation network.
Slide 37: Summary - Some Key Fundamentals
Supporting Sustainability and Livability
- Implement and operate to serve community priorities
- Increase opportunities for safe walking and bicycling
- Improve the transit experience
- Support reliable, efficient movement of people and goods
- Manage travel demand
- Provide information to support choices
- Emphasize connection between land use and transportation
- Climate change adaptation measures
- Performance measurement
- Collaborate and coordinate
Author Notes for Slide 37:
Key Message: The FHWA primer on “The Role of Transportation Systems Management & Operations in Supporting Livability and Sustainability” highlights nine key elements—“fundamentals”—for managing and operating transportation systems in ways that support livability and sustainability. These are listed on this slide.
As discussed throughout this presentation, transportation systems management and ITS technologies can play a critical role in nearly all of these elements.
Slide 38: References
- FHWA, The Role of Transportation Systems Management & Operations in Supporting Livability and Sustainability: A Primer, FHWA-HOP-12-004, January 2012.
- ITS Technology and Sustainable Transportation, ITS America Position Statement, August 2012.
- Barth, M. and K. Boriboonsomsin, “Traffic Congestion and Greenhouse Gases,” TRR News, No. 268 (May-June 2010).
- USDOT, FHWA, “Sustainable Highways Evaluation Tool (INVEST),” https://www.sustainablehighways.org/1/home.html
- AERIS, https://www.its.dot.gov/research_archives/aeris/index.htm
Slide 39: References (Cont.)
- Transportation Research Board, Potential Impacts of Climate Change on U.S. Transportation, Special Report 290, 2008.
- Radow, L. and L. Neudorff, Transportation Adaptation’s Bearing on Planning, Systems Management, Operations, and Emergency Response, TRB Circular E-C152: Adapting Transportation to the Impacts of Climate Change, June 2011.
- Shaheen, Susan A. et al., “Eco-driving and Carbon Footprinting: Understanding How Public Education Can Result in Reduced Greenhouse Gas Emissions and Fuel Use,” Mineta Transportation Institute publication CA-MTI-12-2808, April 2012.
Slide 40: Questions?
- What is “sustainability,” and what is the “triple bottom line” of a sustainable transportation network?
- What is livability, and how is it related to sustainability?
- What is the difference between criteria pollutants and greenhouse gas emissions?
- What role can transportation systems management and operations, and the supporting ITS play in reducing emissions?
- What is eco-driving, and how can ITS promote?
- What is meant by “climate change adaptation,” and what role can TSMO and ITS play in this regard?
- What are some potential performance measures for sustainability and livability?
Author Notes for Slide 40:
- What is sustainability - In the context of transportation, sustainability may be defined as “meeting, and sometimes re-defining, the mobility needs of the present without compromising the ability of future generations to meet their needs.” The triple bottom line refers to a three-dimensional framework consisting of economic (e.g., mobility), social (e.g., safety), and environmental (e.g., emissions) considerations.
- What is livability - May be defined as “using the quality, location, and type of transportation facilities and services available to help achieve broader community goals, such as increasing travel choices, improving economic competitiveness, and enhancing unique community characteristics.” Livability and sustainability share many of the same elements, and the transportation solutions that support each area - including TSMO and ITS - are likely to be similar. Both livability and sustainability address issues of social equity and human health and seek to promote more environmentally friendly travel options and economic activities. The key differences between livability and sustainability are their time frames and scope. Sustainability includes a long-term, multigenerational focus that addresses larger environmental goals such as reducing climate impacts, increasing energy efficiency, and reducing natural resource use. Meanwhile, livability initiatives are often focused on near-term planning, funding, and implementation strategies at the community level.
- Difference between criteria pollutants and greenhouse gas emissions - Both categories constitute various types of vehicle emissions. Criteria pollutants, such as carbon monoxide, ozone, and particulate matter, are regulated by the federal government. Greenhouse gases, such as carbon dioxide, are considered by most scientists to be the primary cause of climate change and global warming. There are currently no Federal standards regarding GHG emissions.
- Role TSMO and ITS can play in reducing emissions - TSMO and ITS technologies have many functions, including congestion management, traffic smoothing, multimodal traveler information, and pricing mechanisms to reduce demand. All of these and other TSMO functions can improve mobility, enhance safety, and also reduce emissions. Depending on the strategies deployed, TSMO can reduce certain emissions by as much as 20%
- What is eco-driving - May be defined as changing driving behavior and vehicle maintenance to reduce fuel consumption and GHG emissions. TMSO and ITS can help promote eco-driving through such strategies as signal coordination (“ride the green wave”), active traffic management (“anticipate traffic flow” and “maintain optimum highway speed”), and in-vehicle navigation systems and displays (“navigate to reduce CO2”).
- What is climate change adaptation - The past several years have been the warmest in recorded history, with many recent examples of severe weather (e.g., Superstorm Sandy). These extreme climate conditions (e.g., very hot days, flooding and closures of segments of the transportation network, reduced visibility, increased hurricane frequency and resulting evacuations) impact the operation of the transportation network. The transportation network must be able to “adapt” to these conditions. TSMO strategies can help with this adaptation via variable speed limits, incident management, traveler information, Integrated Corridor Management, and the like.
- Potential performance measures - Possibilities in this regard include levels of criteria pollutant and GHG emissions, levels of traffic noise, the percentage of destinations in an area that are served by multiple modes providing users with choices (and the extent to which the operation of these various modes are coordinated with multimodal traveler information), and the percentage of trips that are made via walking or cycling. There is also the FHWA Infrastructure Voluntary Evaluation Sustainability Tool (INVEST) for evaluating and scoring highway projects from the perspective of sustainability.
Return to top ↑