ITS ePrimer
Module 11: Sustainable Transportation
Authored by Louis G. Neudorff, Principal Technologist - ITS, CH2M HILL, Virginia Beach, VA, USA
2014
Table of Contents
Purpose
The concept of sustainability has been receiving increased attention over the past several years. This module addresses what is meant by sustainable transportation, identifies the various attributes that make up a sustainable transportation network, and discusses how transportation systems management and operations (TSM&O) and supporting intelligent transportation systems (ITS) technologies can contribute to a sustainable transportation network. Related concepts addressed include livability, climate change adaptation, and performance measures.
Return to top ↑
Objectives
The learning objectives for this module are as follows:
- To understand the broad concept of sustainability.
- To understand the various attributes of a sustainable transportation network, which include economic sustainability, social sustainability, and environmental sustainability.
- To understand what livability is, and how it is related to and different from sustainability.
- To understand the role TSM&O and the supporting ITS technologies can play in enhancing environmental sustainability through the reduction of vehicle emissions, including greenhouse gases that contribute to climate change.
- To understand the role TSM&O and the supporting ITS technologies can play in enhancing livability.
- To understand how other ITS-related technologies and practices (e.g., pricing and in-vehicle devices) can promote reduced emissions.
- To understand how TSM&O and ITS technologies can be used to help adapt to climate change and its impacts.
- To consider financial sustainability in the broader context of sustainable transportation.
- To identify potential sustainability- and livability-related performance measures, their potential application, and the associated data needs.
Return to top ↑
Introduction: The Broad Concept of Sustainability
The most widely quoted definition of sustainability is based on the concept of sustainable development as defined by the Brundtland Commission of the United Nations1 in 1987:
Meeting the needs of the present without compromising the ability of future generations to meet their own needs.
Or perhaps in sound-bite form (attributed to Robert Gray, a professor at the University of Edinburgh), "treating the world as if we intended to stay."
The core of mainstream sustainability thinking has become the idea of three dimensions—environmental, social, and economic sustainability. These are often drawn as interlocking circles (Figure 1), as adopted by the International Union for Conservation of Nature (IUCN), to show that these three dimensions of sustainability need to be integrated better, with action to redress the balance among dimensions.2
These three dimensions are often referred to as the triple bottom line—a phrase first coined in 1994 by John Elkington. His argument was that organizations should be preparing three different (and quite separate) bottom lines consisting of three Ps: profit, people, and planet.3 This triple bottom line is also known as the 3 Es (economic development, social equity, and environment. (Go to https://bigthink.com/videos/the-three-es for more information.)
Figure 1. Three Dimensions of Sustainability
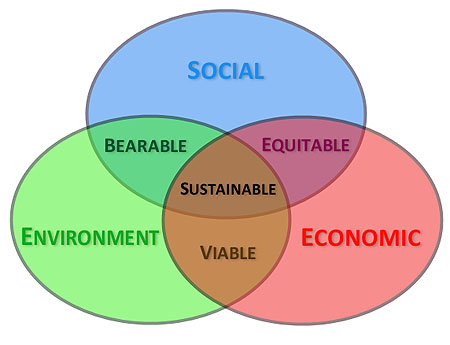
(Extended Text Description: This is a Venn diagram illustrating the "Triple Bottom Line." This are three intersecting circles in a triangle formation. The top circle labeled "Social" is shaded in blue. The lower left circle is colored green and labeled "Environment." The lower right circle is colored pink and labeled "Economic." The right third of the "Environment" circle overlaps with the left third of the "Economic" circle. The upper third area where these two circles overlap also overlap with the lower third area of the "Social" circle above. There are four areas where the circles overlap in varying combinations. On the left side of the overlapping areas, the "Social" and "Environment" circles overlap. This section is a blue-green color and labeled "Bearable." On the right side of the overlapping areas, the "Social" and "Economic" areas combine. That area is colored purple and labeled "Equitable." On the bottom of the overlapping areas, the "Environment" circle overlaps with the "Economic" circle. This area is colored brown and labeled "Viable." In the center of the overlapping areas, all three circles meet, and is also colored brown and labeled "Sustainable.")
The goal of sustainability is, therefore, "the satisfaction of basic social and economic needs, both present and future, and the responsible use of natural resources, all while maintaining or improving the well-being of the environment and ecology on which life depends."4
Sustainable Transportation and ITS
In August 2012, ITS America adopted an updated position statement titled "ITS Technology and Sustainable Transportation."5 The statement addresses "what are the elements of sustainable transportation and how ITS technology can be a part of it" as follows:
"Transportation is an essential and integral component of a sustainable society." ITS America has defined "sustainable transportation" as "meeting, and sometimes re‐defining, the mobility needs of the present without compromising the ability of future generations to meet their needs." There are several attributes associated with these mobility needs—a three-dimensional framework consisting of economic, social, and environmental considerations.
- Economic - Transportation has long been recognized as essential to economic development. Efficient and reliable movement of people and goods—that is, mobility—improves productivity and can spur economic growth.
- Social - People who are economically, socially, or physically disadvantaged need transportation options and choices to give them opportunities to work, learn, and participate in society. Related societal issues include the security and the safety of the transportation network.
- Environmental - On a global scale, the looming threat of climate change has focused attention on the environmental impacts of the transportation sector, which contributes more than 25 percent of our nation's greenhouse gas (GHG) emissions.
Moreover, the concept of sustainable transportation should be addressed in a holistic manner—a collective process whereby decision making and actions carefully evaluate and balance the potential impacts of this "triple bottom line."
TSM&O strategies and the supporting technologies have long been promoted as a tool for improving the efficiency and reliability of the nation's surface transportation system (thereby promoting a vibrant economic sustainability) and for enhancing its safety and security (thereby promoting societal needs). These same technologies and strategies can also be applied to protect and preserve the environment by reducing emissions, including GHGs, a major cause of global warming.
Other modules of this ePrimer describe TSM&O strategies and the supporting ITS technologies from the perspective of mobility and reliability (i.e., economic sustainability) and safety (i.e., a major consideration for social sustainability). As such, the subsequent discussions and examples contained in this module focus on how ITS can contribute to the environmental aspect of the triple bottom line of sustainable transportation.
Livability and Transportation
Before moving to examples of ITS and environmental sustainability, the concept of livability should be discussed. The Federal Highway Administration (FHWA) document "The Role of Transportation Systems Management & Operations in Supporting Livability and Sustainability: A Primer"6 defines livability as "using the quality, location, and type of transportation facilities and services available to help achieve broader community goals, such as increasing travel choices, improving economic competitiveness, and enhancing unique community characteristics. Livability in transportation helps to achieve those goals by leveraging financial resources and using the transportation planning process to advance supportive projects, policies, or decisions. Livability directly benefits people who live in, work in, or visit an area—whether in an urban, suburban, or rural context."
The FHWA Primer goes on to describe livability in relation to transportation as:
- Addressing road safety and capacity issues through better planning, design, and construction.
- Integrating health and community design considerations into the transportation planning process to create more livable places where residents and workers have a full range of transportation choices.
- Using travel demand management (TDM) approaches, and management and operations (M&O) strategies to maximize the efficiency of transportation investments.
- Developing fast, frequent, and dependable public transportation to foster economic development and accessibility to a wide range of housing and employment choices.
- Strategically connecting the modal pieces—bikeways, pedestrian facilities, transit services, and roadways—into a truly intermodal, interconnected system.
- Maximizing and expanding new technologies, such as ITS, green infrastructure, and quiet pavement.
- Enhancing the natural environment through improved storm water mitigation, enhanced air quality, and decreased GHG emissions.
This list includes many components of sustainable transportation (e.g., efficiency, safety, and environment), while also specifically mentioning ITS and M&O. The aforementioned FHWA Primer notes that, in practice, elements of livability and sustainability are closely related, and the transportation solutions that support each area are likely to be similar. Both livability and sustainability address issues of social equity and human health and seek to promote more environmentally friendly travel options and economic activities. The key differences between livability and sustainability are their timeframes and scope. Sustainability includes a long-term, multigenerational focus that addresses larger environmental goals, such as reducing climate impacts, increasing energy efficiency, and reducing natural resource use. Livability initiatives are often focused on near-term planning, funding, and implementation strategies at the community level. Livable transportation systems accommodate a range of transportation modes (walking, bicycling, public transit, and automobiles) by creating balanced, multimodal transportation networks that offer multiple transportation choices.
Examples of TSM&O and ITS in Support of Sustainability and Livability
Overview
The FHWA Primer6 highlights several elements for managing and operating transportation systems in ways that support both livability and sustainability. TSM&O and the supporting ITS technologies* support several of these key elements, for example:
- Improve the Transit Experience - Improving travel choices by increasing the attractiveness and performance of public transit is a central component of making communities more livable and sustainable. Transit helps reduce vehicle travel and congestion, leading to fewer criteria pollutant and GHG emissions. Using public transit instead of driving can reduce stress for travelers, improving their overall quality of life. For a community, transit boosts social equity by providing mobility and accessibility. TSM&O strategies in this regard include transit signal priority, bus rapid transit, and use of shoulders for buses.
- Support Reliable, Efficient Movement of People and Goods - One of the fundamental aims of M&O strategies is to actively support efficient and reliable mobility for people and goods. Particularly in congested regions and corridors, M&O strategies applied strategically can help to avoid the need for major capacity expansions, which are costly and may not fit within community visions, while improving mobility for people and goods and supporting improved safety, air quality, regional economic vitality, and land use efficiency. Example strategies include incident and emergency management, travel weather management, work zone management, planned special events management, automated toll collection, adaptive traffic signal control, traffic signal timing to make it easier for pedestrians to cross, reversible lanes, shoulder lanes, ramp metering, and other active traffic management techniques.
- Manage Travel Demand - Managing and operating the transportation system to improve livability and sustainability means not only reducing unnecessary travel delays but also managing travel demand in ways that support more transportation choices and more efficient use of the transportation system. Transportation demand management (TDM) includes a host of strategies that encourage travelers to use the transportation system in a way that contributes less to congestion, improves air quality, and enhances quality of life. ITS-related strategies include pricing techniques, such as variably priced toll lanes, parking pricing, and higher transit fares in the peak period for congested transit systems.
- Provide Information to Support Choices - Managing and operating a multimodal transportation system for improved livability and sustainability involves providing timely and accurate information to system users on transportation conditions (e.g., a strategy associated with integrated corridor management). With a greater level of awareness, travelers and freight carriers can make better decisions about when or if to travel, which route to take, and which mode to choose. This contributes to livability through greater predictability of services, more options for avoiding delay, and a higher-quality travel experience. In addition, this information can save lives and reduce injuries by informing the public when road conditions are unsafe and enabling commercial vehicle drivers to locate available parking for critical rest periods. Providing traveler information that helps system users avoid congestion and facilitates taking transit, walking, and bicycling significantly supports environmental sustainability by reducing motor vehicle emissions and infrastructure needs. Traveler information is also crucial in diverting traffic or passengers during an incident, in adverse weather, and around active work zones.
The key message from the FHWA Primer is that many of the same TSM&O strategies and supporting ITS technologies that support sustainable transportation can also help enhance livability. These TSM&O strategies can "help improve how existing transportation systems interface with the communities they serve. As a result, considering how transportation is managed and operated can be a vital aspect of supporting livable communities and sustainable planning efforts."6
From the perspective of environmental sustainability, TSM&O and ITS can reduce vehicle emissions. This is discussed below in terms of criteria pollutants and GHGs.
Reducing Criteria Pollutants
The National Ambient Air Quality Standards (NAAQS) is a set of Federal standards that detail the allowable concentrations and exposure limits for certain pollutants. Air quality standards have been established for several of these criteria pollutants associated with transportation, including carbon monoxide (CO), ozone, and particulate matter (PM-10 and PM-2.5†). If monitored levels violate the NAAQS, then the Environmental Protection Agency (EPA), in cooperation with the State, will designate the contributing area as nonattainment. In addition to direct pollutant emissions, motor vehicles emit precursors that contribute to pollutant concentrations, including nitrogen oxides (NOx), volatile organic compounds (VOCs), sulfur oxides (SOx), and ammonia (NH3).
Transportation is a major source of a number of these air pollutant emissions. Nationally, on-road transportation sources are responsible for 13 percent of VOCs emissions, 35 percent of NOx emissions, and 38 percent of CO emissions.7 Emissions from most transportation sources have been declining for the last two decades,‡ and are projected to continue to decline because of the beneficial effects of improved emission control technologies and more stringent emission regulations. Since 1991, the Congestion Mitigation and Air Quality Improvement (CMAQ) program has devoted more than $14 billion in highway funds for projects that reduce emissions and relieve congestion, most of which have been implemented by transportation agencies. Transportation, however, will continue to contribute to regional air pollution for years to come.
A 2006 FHWA document titled "General Emission Impacts of Transportation System Management Strategies"8 provides a compendium of traditional and innovative transportation-related control strategies, and for each type of strategy, identifies effects on the following seven pollutants: CO, PM-10, PM-2.5, NOx, VOCs, SOx, and NH3. For each strategy, the document reports on the direction of emissions impacts (increase, decrease, neutral, or uncertain) typically expected for each pollutant. With respect to TSM&O, the report indicates those strategies that reduce vehicle miles traveled (VMT), vehicle trips, and vehicle idling reduce all air pollutants. Strategies that affect vehicle travel speeds will generally show no effect on PM, SOx, and NH3, and might result in either an increase or decrease in CO, NOx, and VOCs depending on the starting vehicle speeds and level of speed change.
The FHWA ITS benefits database (www.itskrs.its.dot.gov/benefits) provides information on the energy and environmental benefits (and other operational benefits) for several TSM&O strategies. Some of these are summarized in Table 1. Another example of the benefits resulting from traffic signal control is provided in the Institute of Transportation (ITE) 2007 National Traffic Signal Report Card,9 which concludes that "if the nation supported its signals at an A level, we would see significant benefits in the protection of the environment, including reductions in harmful emissions (carbon monoxide, nitrogen oxides and volatile organic compounds) up to 22 percent."
In addition to Stockholm, Sweden, (listed in Table 1), another example of congestion pricing and the beneficial impacts on emissions is a system in London, England (Figure 2a). This system operates between 7 a.m. and 6 p.m., Monday through Friday (excluding holidays) and depends on automated license plate readers (ALPR) (Figure 2b) to verify if each and every vehicle entering the zone has registered and paid for that day. The impacts of congestion pricing are regularly monitored by Transport for London (TfL), including various air quality measures. TfL's "Sixth Annual Impacts Monitoring Report"10 concluded that "by reducing the volume of traffic circulating within the (central) charging zone and improving the efficiency with which it circulates, it was estimated that congestion charging had been directly responsible for reductions inside the original charging zone of 8 percent in road traffic emissions of oxides of nitrogen (NOx) and 6 percent in emissions of fine particulate matter (PM10). These figures were for emissions from all road traffic sources (only), on an annual total basis. All other things being equal, these reductions will have persisted in the years after 2003."
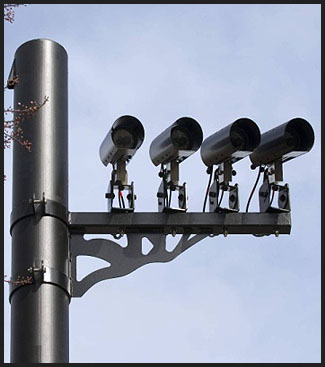
Another example of ITS technology being used directly to reduce emissions is the low-emission zone (LEZ) in London.11 The LEZ was introduced in 2008 to encourage the most polluting heavy-diesel vehicles driving in the city to become cleaner. The LEZ covers most of Greater London as shown in Figure 3. To drive within the zone without paying a daily charge, vehicles such as trucks (lorries), buses, larger vans, and mini-buses must meet certain emissions standards that limit the amount of particulate matter coming from their exhausts. ALPR cameras read the license plates of vehicles that drive within the LEZ and check them against a database of registered vehicles to automatically determine if the vehicle meets the LEZ emissions standards, is exempt, is registered for a discount, or if the daily charge has been paid.12 Per the Mayor of London's Air Quality Strategy,13 the LEZ has resulted in cleaner HGV (heavy goods vehicles), bus and coach fleets in London.
Table 1. Emission Benefits from TSM&O Strategies
| TSMO Strategy |
Examples |
| Congestion Pricing |
- In Stockholm the permanent charging program (Cordon Charging) produced improvements in the environment by reducing carbon dioxide by 10 to 14 percent, NOX by 7 percent, and particulates by 9 percent
|
| Electronic Toll Collection |
- An evaluation of electronic toll collection systems at three major toll plazas outside Baltimore, Maryland, indicated these systems reduced environmentally harmful emissions by 16 to 63 percent
- The E-ZPass electronic toll collection system on the New Jersey Turnpike eliminated approximately 0.35 tons of VOC and 0.056 tons NOx per weekday
|
| Traveler Information |
- A personalized travel planning system helps commuters choose environmentally friendly routes and modes; reduces carbon dioxide emissions by 20 percent
- Simulation results indicated that vehicle emissions could be reduced by 2 percent if arterial traffic flow data were included in the traveler information system in Seattle, Washington
|
| Traffic Signal Control |
- In Oakland County, Michigan, retiming 640 traffic signals during a two-phase project resulted in carbon monoxide reductions of 1.7 and 2.5 percent, nitrogen oxide reductions of 1.9 and 3.5 percent, and hydrocarbon reductions of 2.7 and 4.2 percent
- By implementing coordinated signal timing on the arterial network in Syracuse, New York, average vehicle emissions decreased by 9 to 13 percent
- An adaptive signal control system in Toronto, Canada, reduced vehicle emissions by 3 to 6 percent
- Installation of adaptive signal control systems in two corridors in Colorado reduced pollution emissions by up to 17 percent
|
| Ramp Control |
- Net annual vehicle emissions increased by 1,160 tons when the ramp metering system on Minneapolis-St. Paul freeways was shut down
|
| Transit Operations |
- Simulation of a transit signal priority system in Helsinki, Finland, indicated that nitrogen oxides were reduced by 4.9 percent, carbon monoxide decreased by 1.8 percent, hydrocarbons declined by 1.2 percent, and particulate matter decreased by 1.0 percent
|
| Incident Management |
- In Georgia, the NaviGAtor incident management program contributed to decreased emissions: 2,457 tons less carbon monoxide, 186 tons less hydrocarbons, and 262 tons less nitrous oxides
|
Source: FHWA ITS benefits database (www.itskrs.its.dot.gov/benefits).
Figures 2a and 2b. London Congestion Pricing Zone and ALPR Cameras
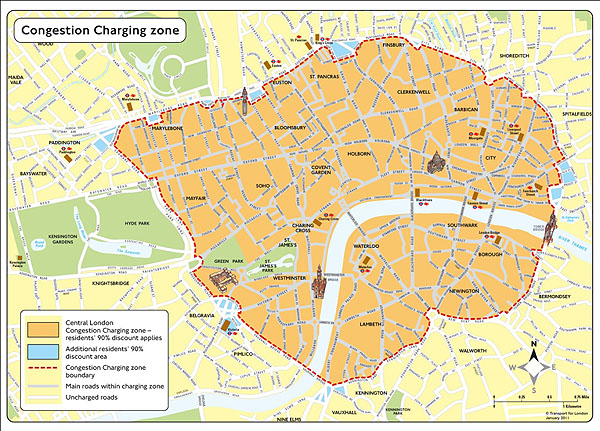
(Extended Text Description: This image includes a map of the London congestion pricing zone. The map shows the streets, parks and river Thames through downtown London. In the upper left corner is a text box labeled Congestion Charging Zone. In the lower left corner is a legend with the following information: orange box - Central London, Congestion Charging zone - residents' 90% discount applies; blue box - Additional residents 90% discount; red dotted line - Congestion Charging zone boundary; gray line - Main roads within charging zone; white line - uncharged roads. There are a few small areas near the edges of this area that are marked in blue. The area near the center of the map is outlined in a red dotted line and colored in orange.)
Source for map: www.tfl.gov.uk/tfl/roadusers/congestioncharge/whereandwhen/.
Figure 3. London Low Emission Zone
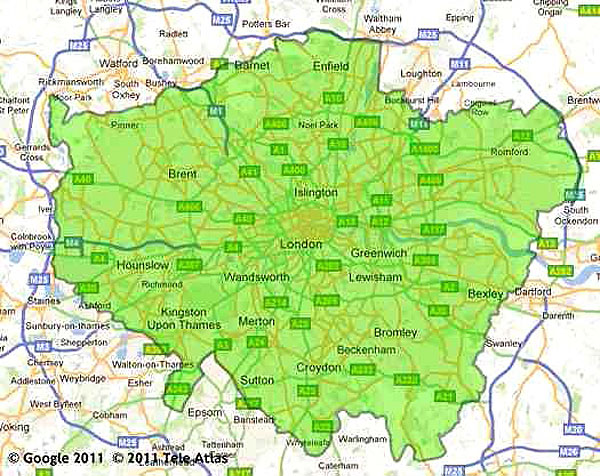
(Extended Text Description: This is a map of the Low Emission Zone in London, England. The area within the London city limits are shaded in green. The LEZ limits extend from Enfield to the north to Sutton in the south, and Hounslow in the west to Romford and Bexley in the east. Additional Author notes: Key Message: Transport for London has also initiated a Low Emission Zone around London. All trucks, vans, and buses must register to enter the zone. Any truck, van, or bus that does not meet European standards for vehicle emissions must pay a daily charge to enter the zone. Automated License Plate Readers (ALPR) are installed at all entrances to zone and record the license plate numbers, which are checked against the database of registered vehicles. If a nonregistered vehicle enters the zone they may be subject to a penalty charge. As you can see from the information on the figure, the results have been very positive.)
Source: www.tfl.gov.uk/roadusers/lez/default.aspx.
Reducing Greenhouse Gases
Unlike most other parts of the world, currently, there are no Federal regulations in the United States addressing or limiting the amount of GHG emissions (although some States have adopted measures). Greenhouse gases include carbon dioxide (CO2), methane (CH4), nitrous oxide (N2O), and hydrofluorocarbons; of which CO2, having an atmospheric lifetime of 50 to 100 years, is the most important.
The 2007 report14 by the United Nations' Intergovernmental Panel on Climate Change (IPCC) concluded that global warming and the associated changes in climate, is "unequivocal"—a conclusion based on observed increases in global air and ocean temperatures, widespread melting of snow and ice, and rising global average sea levels. The IPCC report also stated that the increase in global average temperatures since the mid-20th century is "very likely"§ due to increases in greenhouse gas concentrations resulting from human activities.
CO2 is the primary GHG emitted through human activities, accounting for 84 percent of all GHG emission in the United States in 2010.15 The transportation end-use sector accounted for 33 percent of these CO2 emissions in 2010. Among domestic transportation sources, light-duty vehicles (including passenger cars and light-duty trucks) represented 61 percent of these transportation-related CO2 emissions, and medium- and heavy-trucks 22 percent. Passenger car CO2 emissions increased by 20 percent from 1990 to 2012.16 Thus, traffic flow on the nation's highways accounted for more than a quarter of all GHG emissions in the United States.
There are several ways to reduce transportation-related GHG emissions,** including:
- Improving the fuel economy of vehicles (e.g., miles per gallon). Fuel efficiency translates as miles per gallon and is addressed by the Corporate Average Fuel Economy (CAFE) standards mandated by the Federal government. The CAFE standards were increased in 2012—an average 35.5 miles per gallon (mpg) for vehicle fleets in 2016, and an average of 54.5 mpg in 2025. This can be achieved in vehicles with newer internal combustion engine (ICE) technology, such as regenerative breaking, start-stop technology (e.g., the engine automatically shuts off when the vehicle stops at a traffic signal, and turns back on when the accelerator is pushed), and in vehicles that use alternative fuels.
- Reducing the carbon content of the fuel used. Alternative fueled vehicles are generating significant interest and include all-electric vehicles and gas/electric hybrids (including plug-in hybrids). The future may also include hydrogen-powered vehicles.
- Decreasing the amount of driving or VMT. This may be accomplished via improvements in transit service alternatives to promote mode-shifts, demand management measures such a pricing, telecommuting measures to eliminate trips, and, in the longer term, land use policies that promote compact and transit-oriented development.
- Transportation system operations can be improved through a variety of TSM&O strategies and the supporting ITS technologies. These include, as discussed in previous modules, synchronized and adaptive signal timing at intersections; active traffic management (ATM) systems providing variable speed limits and dynamic lane control; traffic incident and emergency management systems; transit signal priority systems; real-time traffic and multimodal travel information; dynamic routing; integrated corridor management; smart transit and parking systems; electronic and open road toll collection; and more.
GHG Reductions from TSM&O
An example of a speed-based CO2 emissions curve for a typical vehicle traveling on a highway section (solid blue lines as shown in Figure 4) was developed by Matthew Barth and Kanok Boriboonsomsin,18 at the Center for Environmental Research and Technology (CERT, University of California at Riverside). The dashed red line represents the approximate lower bound of CO2 emissions for vehicles traveling at constant steady-state speeds as a result of improved traffic operations, including:
- Congestion mitigation strategies that reduce severe congestion such that higher average traffic speeds are achieved (e.g., ramp metering and incident management).
- Traffic flow smoothing techniques that can harmonize speeds and suppress shock waves, thus reducing the number of acceleration and deceleration events (e.g., variable speed limits, and dynamic lane assignment as provided by active traffic management, and intelligent speed adaptation).
- Speed management techniques that can bring down excessive speeds to more moderate speeds of approximately 55 mph (e.g., better enforcement).
Figure 4. Use of Traffic Operation Strategies in Reducing On-Road CO2 Emissions
(Extended Text Description: This graph represents speed-based CO2 emissions as compared to the average speed a vehicle is traveling in miles per hour. The horizontal x-axis at the bottom of the graph is labeled "Average Speed (mph)." Units are marked from 0 to 90 in intervals of 5 miles per hour. The vertical y-axis is labeled "CO2 (g/mi)." Units along this axis go from 0 to 1000 in intervals of 100. At the upper right of the graph is the graph legend. There are two items in the legend. The first item shows a horizontal blue line with the words "Real-world activity" written to its right. Below that item is a horizontal dashed red line. To the right of this line are the words "Steady-state activity." On the graph the solid blue curve is the speed-based CO2 emissions curve for a typical vehicle traveling. This line starts at the 1000 g/mi of CO2 at just over 5 miles per hour, curves downward and plateaus at 35 miles per hour just above the 300 g/mi CO2 line, and continues on that level until it begins to rise again at the 65 miles per hour mark until it reaches the 90 mile per hour mark just above the 600 g/mi CO2 mark. Below the blue line is a the dashed red line, which is the approximate lower bound of CO2 emissions for vehicles traveling at constant steady-state speeds as a result of improved traffic operations. This line begins just before 5 miles per hour at 1000 g/mi mark and travels in a downward curve until it reaches its lowest point at the 30 miles per hour mark at between the 200 and 300 g/mi CO2 level. It then begins to rise again, overlaps with the solid blue line and then separates again until it reaches the 90 mile per hour mark just below the 600 g/mi CO2 line. As the blue and dashed red curves go on their initial downward trajectory, to the right of the blue line, there is black arrow pointing downwards and to the right labeled "congestion mitigation." As the blue and dashed red lines begin to level out at the bottom of the curve, there is a black arrow pointing straight down from the blue line to the red line labeled "traffic smoothing." As the curves rise again from the 75 to 85 miles per hour mark, there is a black arrow pointing down and to the left labeled "speed management.")
Other research on the reduction in GHG emissions resulting from TSM&O and ITS is summarized below.
- Traffic signal coordination is addressed in multiple references. The Information Technology and Innovation Foundation report on Intelligent Transportation Systems19 indicates that "applying real-time traffic data to U.S. traffic signal lights can improve traffic flow significantly, reducing stops by as much as 40 percent, reducing travel time by as much as 25 percent, cutting gas consumption by 10 percent, and cutting emissions by 22 percent (cutting daily carbon dioxide emissions by 9,600 tons)." A report published by ITE—"Energy Impacts of Urban Transportation Improvements"20—examined data from several systems and concluded that the benefits from traffic signal interconnection and timing plan optimization provide an area-wide reduction in total fuel consumption (which is directly related to CO2 emissions) of 3.5 percent. The adaptive traffic signal control system in the City of Stockholm, Sweden, (i.e., their MATSIS project21) has resulted in a reduction in CO2 emissions of approximately 2,900 tons per year, with the "cost per kg saved CO2 is among the lowest of all environmental projects carried out by the City of Stockholm."
- Several categories of TSM&O strategies—including congestion mitigation strategies such as ramp metering and incident management; speed management techniques (e.g., automated enforcement) that can bring down excessive speeds to a more moderate level (i.e., 55 mph); and traffic flow smoothing techniques (e.g., variable speed limits) that reduce the number of acceleration and deceleration events—were analyzed by Barth and Boriboonsomsin22 using the Comprehensive Modal Emissions Model (CMEM) for a typical traffic condition in southern California. The study indicated that "each of the three methods could potentially lower CO2 by 7 to 12 percent. Although the individual effects may not be that large, the synergistic effect of the three methods combined could add up to a greater amount (i.e., almost 20 percent)."
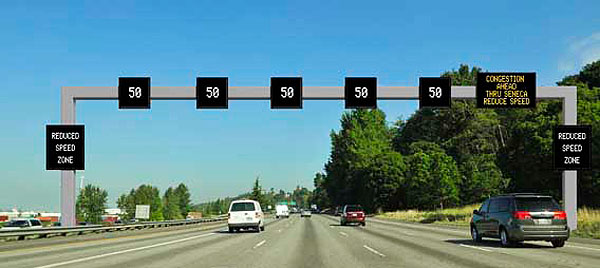
- A system that would provide dynamic speed recommendations to drivers based on traffic conditions (e.g., level of service and congestion levels) and other external variables such as weather conditions was also evaluated by Barth and Boriboonsomsin23 using the CMEM model and data from the California Freeway Performance Measurement System. It was determined that providing this dynamic advice to drivers—and thereby smoothing traffic flow during congested conditions—could result in approximately 10 to 20 percent reductions in fuel consumption and CO2 emissions without drastically affecting overall travel times. (Note: The analysis assumed that the dynamic speed advice would be provided via an in-vehicle device; but the same information could also be provided via variable speed limit signs installed as part of an active traffic management system as shown in Figure 5.)
- A study of the variable speed limit system on the M25 around London, England,24 indicates that the "original main aims of the project were to provide a smooth traffic flow, to improve journey times, journey time reliability and lane utilization, and to reduce the incidence of stop-start driving, while removing some of the stresses of driving. Subsequent notable achievements included the development of proven technology and the reduction in environmental problems (i.e., noise and pollution)." In addition to decreasing the typical number of shockwaves during the morning rush hour and reducing the number and severity of accidents, "emissions have decreased overall by between 2 percent and 8 percent. The weekday traffic noise adjacent to the scheme has reduced by 0.7dB."
- The Information Technology and Innovation Foundation report on ITS25 indicated that "by 2010, Japan expects to reduce CO2 emissions by 31 million tons below 2001 levels, with 9 million tons of reduction coming from more fuel efficient vehicles, 11 million tons from improved traffic flow, and 11 million tons from more effective use of vehicles, the latter two a direct benefit of the country's investments in ITS."
Figure 5. ATM Consisting of Variable Speed Limits and Speed Harmonization
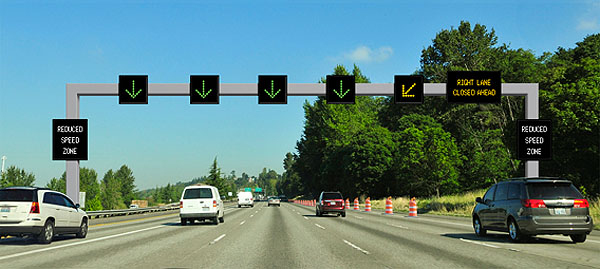
Source: Courtesy Washington State DOT.
These results strongly indicate that TSMO strategies and the supporting ITS technologies have an important role to play in reducing GHG emissions from the surface transportation network. Not all such research, however, has been so favorable toward ITS-based strategies and their ability to reduce GHG emissions. The most notable of these is "Moving Cooler: An Analysis of Transportation Strategies for Reducing Greenhouse Gas Emissions."26 The language in the "Moving Cooler" report summarizes operations and ITS as follows:
Transportation System Changes that improve the flow of traffic generally provide GHG reduction of about 0.1 percent reduction†† compared to baseline. Together these system operations improvements can result in cumulative reductions as high as 0.6 percent from the baseline. Given the technology investments assumed for these improvements, implementation costs for most tend to be higher than anticipated vehicle cost savings. Recall though, that vehicle cost savings evaluated through 'Moving Cooler' do not include cost associated with travel time and safety benefits, which are the most substantial benefits of these strategies.
This "0.3 to 0.6 percent cumulative reduction" in CO2 over a 40-year period from ITS is very low compared to the results from other studies and analyses summarized above. Moreover, it is lower than most of the other strategies evaluated as shown in Table 2.
Table 2. Summary of "Moving Cooler" Results
| Cumulative Reductions in GHG Emissions from Baseline: 2010-2050 |
Min |
Max |
| PAYD Insurance + VMT Fees |
1.2 % |
7.1 % |
| Regional Congestion Pricing |
0.8 % |
1.8 % |
| Combined Land Use Strategies |
0.3 % |
2.1 % |
| Combined pedestrian / bicycling strategies |
0.2 % |
0.5 % |
| Transit Capital Improvements |
0.4 % |
1.1 % |
| Employer-Based Commute Strategies |
NA |
1.7 % |
| Lower/Enforced Speed Limits |
2.0 % |
3.6 % |
| Eco-Driving |
1.1 % |
2.7 % |
| ITS/Operations |
0.3 % |
0.6 % |
| Freight (Truck APUs/Rail Capacity) |
NA |
0.4 % |
| Highway Expansion/Bottleneck Improvements |
Increase in GHG emissions |
A review of this table brings forth two issues:
- Several of the other strategies—particularly congestion pricing‡‡ and lower/enforced speed limits—require ITS technologies to operate effectively. Moreover, eco-driving (as is discussed in greater detail later in this module), can benefit from TSM&O and ITS.
- Possible reasons why the results for ITS/Operations from "Moving Cooler" are so much lower than other studies.
A paper prepared for ITS America27 examined the "Moving Cooler" results and assumptions as they relate to TSM&O strategies and supporting ITS technologies, and identified several likely reasons for the differences between the "Moving Cooler" results and other studies. By far, the most significant difference involved assumptions regarding induced demand. Whereas the other studies and analyses previously noted estimate the reductions in GHG emissions immediately following or just a few years after deployment of operational strategies and ITS, the "Moving Cooler" analyses covers a 40-year period and includes an estimate of induced VMT. Specifically, the impact of this induced demand for operations strategies—as calculated by "Moving Cooler"—is an average offset of 63 to 74 percent of the cumulative GHG reductions from the reduced delay. This inclusion (or non-inclusion) of induced demand in the analyses accounts for much, if not most, of the disparity in results.
Induced Demand Considerations
The issue of induced demand is not a trivial one. Many in the environmental community think that much of the improvements that ITS technology offers will be wiped out over time by induced demand. That is, additional traffic will start to use the roadway as a result of our good efforts to improve travel times and overall reliability. In the past, this was not seen as an obstacle because traffic and VMT is highly correlated with economic growth. But if GHG reduction is one of the goals for sustainable transportation, the ITS community needs to address this concern. Moreover, the research and assumptions regarding induced demand (resulting from travel time improvements) have been based on capacity additions; something very different from improved efficiency of the existing infrastructure provided by transportation technology.
An in-depth analysis of induced demand is beyond the scope of this document, but a few key considerations are worth mentioning.
- Induced demand may be defined as "the additional travel that occurs as a result of lowering the generalized cost of travel (excluding the independent increases due to population and income growth). In economic terms, when the generalized price of travel goes down because travel is made easier or faster or more convenient (e.g., an increase in supply), the additional quantity of travel that occurs is induced demand. The largest element of that price, or 'generalized cost,' is travel time. Other components of the generalized price include fuel, maintenance, accidents / insurance, wear and ownership, fees, and parking."28
- The magnitude of induced demand is typically identified for both short-term and long-term periods, reflecting different behavioral effects. Short-term effects can include changes in travel departure times, route switches, mode switches, longer trips, and some increase in trip generation. Long-term effects are related to how land use and development patterns adjust to the newly increased accessibility, subsequently generating new or extended trips.
- It appears that all of the research on induced demand and the resulting estimates of elasticity, including the values in the "Moving Cooler" analysis, have been based on the demand inducing effects of new transportation capacity (e.g., expanding existing roads or constructing new facilities).
TSM&O strategies and additional capacity are not the same thing. In general, operational strategies and the supporting ITS do not add capacity (with the possible exception of hard shoulder running); rather, they promote a more efficient use of the existing capacity, maximizing the potential throughput of the infrastructure (as defined by the facility's capacity). Capacity actions consist more of increased peak-period mobility, while efficiency actions aim to enhance quality of flow (i.e., manage and potentially reduce congestion) throughout the day—an important distinction.29 Moreover, TSM&O strategies can support land preservation and reduce sprawl by limiting new infrastructure development—reducing or delaying the need to build additional highway capacity—contributing to the principle of "fix it first."30
The improved efficiency and enhanced quality of flow resulting from ITS does reduce travel time (and costs) of the trip, and it may also enhance reliability, thereby allowing travelers to retime their trips nearer to their preferred time. Economics indicate that these improvements, in turn, induce additional demand and an increase in VMT. As such, there are undoubtedly some levels of short-term induced demand. One must also question, however, if new developments and trip generators have ever been built (i.e., the concept of long-term induced demand) due to improved traffic signal coordination, incident management programs, ramp metering, and other operational improvements and ITS. It is usually the other way around—TSM&O strategies and ITS are deployed in response to new developments and trip generators. More research is needed, but a strong case can be made that the induced demand impacts from TSM&O/ITS are much less than assumed in the "Moving Cooler" analyses.
TMS&O and Potential Carbon Offsets
The issue of induced demand, and its impact on the long-term GHG reduction benefits resulting from TSM&O, could become very important in the future should carbon markets around the world expand and mature. The elimination of GHG emissions from TSM&O could conceivably be converted into tradeable offset credits, which in turn could be sold as part of a cap-and-trade§§ program, thereby providing another revenue source for implementing TSM&O and ITS. (Entities purchasing the credits would use them to help meet their compliance obligations.)
There is a TSM&O/ITS example of this. The Portland (Oregon) Bureau of Transportation spearheaded a project to improve traffic signal timing at 17 major arterials, including some of the most congested thoroughfares in Portland. The city's program costs were covered through a pay-for-performance contract with The Climate Trust, under which the nonprofit organization paid the city based on the amount of CO2 emissions that are saved through the traffic signal optimization project. The city then transferred ownership of the CO2 credits from the project's reduced emissions to The Climate Trust, which retired the credits.
A GHG offset represents a reduction, avoidance, destruction, or sequestration of GHG emissions from a source not covered by an emission reduction requirement. Before a project can create an offset credit, the emission reductions must generally meet criteria in several categories, including:
- Real - GHG-emission reductions should represent actual emission reductions
- Measurable - Emission reductions from offset projects must be accurately quantified.
- Additional - Offset-project reductions must be shown to be in addition to reductions that would have occurred without the offset project
- Monitored - Offset projects must be monitored to ensure that emission reductions are occurring.
- Independently verified - All GHG reductions should be verified by either a third party or a government agency according to accepted methodologies.
- Measured from a credible baseline - A credible baseline, or without-project emissions estimate, must be established in order to measure an offset project's reductions.
- Permanent - Offset-emission reductions can sometimes be reversed either by human activity and/or by acts of nature.
TSM&O/ITS project should qualify on all these counts; although as previously noted, there are many in the environmental community who do not think the GHG benefits are permanent due to induced demand. This is an issue that deserves additional research.
Eco-Driving
Eco-driving is the concept of changing driving behavior and vehicle maintenance to impact fuel consumption and GHG emissions in existing vehicles. The eco can easily stand for ecology as well as economy. Numerous resources and guidance on eco-driving exist on the Web.31,32,33,34 Table 3 provides a summary of these best practices for eco-driving.
Table 3. Summary of Best Practices for Eco-Driving
Driving
- Anticipate traffic flow (act rather than react)
- Avoid rapid starts and stops (accelerate and brake smoothly)
- Maintain an optimum highway speed for good mileage
- Ride the green wave
- Use cruise control
- Navigate to reduce carbon dioxide
- Avoid short trips
- Avoid excess idling (turn off engine when stopped)
- Use the highest gear possible
- Minimize A/C use
- Buy an automated pass for toll roads
|
Maintenance and Other Considerations
- Keep tires properly inflated
- Obey your Check Engine light (regular service and maintenance)
- Choose the right oil
- Remove excess weight
- Streamline vehicle's aerodynamics
|
There are no technologies associated with eco-driving as it is defined in the "Moving Cooler" study;*** rather, this strategy and the resulting reductions in GHG emissions is dependent on changing the efficiency of individual driving behavior and improving vehicle maintenance through public awareness campaigns and training programs. These education programs have been successful in several European countries, and are now gaining prominence in North America. As a practice, promoting eco-driving via public education and the Internet-based information dissemination is now gaining attention among automakers, policy makers, and researchers because it costs little to implement. Moreover, eco-driving practices can be applied to almost any vehicle. A recent study35 at the University of California, Berkeley, assessed the effectiveness of static eco-driving web-based information. A comparison of the experimental and control groups found that exposure to eco-driving information influenced people's driving behavior and maintenance practices. Overall, 57 percent of experimental group respondents increased their eco-driving score. The experimental group's distributional shift was statistically significant, particularly for key practices including lower highway cruising speed and driving behavior adjustment. Fewer respondents significantly changed their maintenance practices (16 percent) than the majority that altered some driving practices (71 percent); this suggests intentional altering of driving behavior is easier than planning better maintenance practices.†††
It is clear that not everyone modifies behavior as a result of static information, and some may only do so in small ways. Several TSM&O strategies and ITS technologies can further promote a number of the eco-driving best practices, for example:
- Anticipate traffic flow (act rather than react) - One of the major objectives of real-time en route traveler information and dynamic lane assignment is to inform drivers of conditions ahead, thereby allowing them to anticipate and make informed decisions.
- Maintain optimum highway speed - This is one of the goals of variable speed limits and speed harmonization as provided by ATM. A smoother traffic flow is also provided by several TSM&O strategies, including incident management, ramp management, integrated corridor management, and others.
- Ride the green wave - This requires the implementation of arterial traffic management systems to create the green wave in the first place.
- Navigate to reduce CO2 - This can be greatly enhanced via real-time traveler information which, in turn, requires ITS technologies to collect this information for all facilities and modes comprising the transportation network, to integrate the information from multiple sources, and then to present the information in such a manner that the user can make informed decisions as to the time of their travel, the mode, or whether to make the trip at all. Navigation systems have traditionally utilized algorithms that attempt to minimize trip distance and/or travel time. This is now being taken one step further with new navigation techniques being developed that focus on minimizing energy consumption and vehicle emissions. Several smartphone apps are available for measuring the carbon footprint of one's trips and driving habits.
Connected vehicle technologies and applications are envisioned that will facilitate eco-driving [e.g., vehicle-to-vehicle (V2V) and communications using road grade information.) After-market providers are already offering driver-feedback functions that allow drivers to see instantaneous fuel consumption and emissions, and/or provide dynamic eco-driving interventions that provide advice to drivers on how to drive in real time.
Potential Increases in Emissions from TSM&O and ITS
While TSM&O strategies and the supporting ITS technologies can reduce direct emissions (including GHGs) in the vicinity of a transportation network, they may also increase a transportation agency's overall carbon footprint through an increase in indirect emissions, such as the electrical power for the ITS devices and TMC hardware, heating and cooling of the TMC, and additional home-work trips for any new TMC staff. Several entities involved in transportation are members of the Climate Registry, which has developed a general reporting protocol that addresses what to report, quantifying emissions, and reporting emissions.36 When developing and designing ITS-based systems, the complete carbon footprint should be considered. It may be feasible to use renewable energy sources for the operations and maintenance of transportation facilities, thereby reducing the carbon footprint.
Climate Change Adaptation
Climate change is not a new phenomenon in the history of the planet. Over the millennia, the planet has seen cycles of warming and cooling‡‡‡—the result of the earth's endlessly changing orbit around the sun and its wobbly rotation around its own axis, variations in solar output, and more recently human activities (e.g., GHG emissions from fossil fuels and deforestation). The consequences of climate change and temperature variations have been significant, contributing to shifts in the balances within and between different regions, and impacting migration patterns, population growth, and social development in the ancient world. In his book "Why the West Rules—For Now,"37 Ian Morris calls climate change one of the four horsemen of the apocalypse contributing to upheavals to civilization.
There have been many such periods of warming and cooling throughout the planet's history.§§§ And so it continues into the present. Statistics from the National Climate Data Center (NCDC) indicate that of the 10 warmest years on record—since such record keeping began in 1880—nine occurred in the last decade (2001 to 2010), with 2008 ranking 11th. Moreover, temperature reconstructions indicate that the global mean surface temperatures over the last 25 years have been higher than any comparable period since AD 1600, and probably since AD 900.38
Per the IPCC,39 increased temperatures in the last decade demonstrate a more rapid increase in temperature rise than previous decades, with 11 out of 12 years from 1995 to 2006 being among the warmest in recorded history. Changes have been the largest over landmasses and at the northern latitudes, including North America. Temperature changes impact other aspects of climate, such as wind patterns, storms, and precipitation. Increased global temperatures since pre-Industrial times have corresponded to an increase in atmospheric levels of GHGs.
There are many recent examples of extreme weather conditions, such as:
- The December 2010 snowstorm in New York City left many subway and train riders stranded on unheated trains. This was followed by the second snowiest January in southern New England, resulting in many collapsed roofs.
- The early February 2011 storm paralyzed States from the Midwest to New England leaving many motorists and users of transit stranded in many States across the country. Associated Press articles noted that the storm left as much as 2 feet of snow across its 2,000-mile path, crippling airports and stranding drivers from Texas to South Dakota, where authorities rescued motorists who had become trapped in more than 150 vehicles.
- California's blistering heat wave in the fall of 2010 sent temperatures to an all-time record high of 113 degrees in downtown Los Angeles, causing power outages and raising wildfire concerns.
- Heat waves resulted in significant health concerns, such as the 40,000 deaths during the 2003 European heat wave and the 11,000 deaths during the 2010 heat wave in Moscow, Russia.
- The 2010 floods in northern New South Wales and southern Queensland, Australia, which ended a decade of drought (said to be Australia's worst in a century), were followed by another flood in Queenstown, Australia, in January 2011 with three quarters of the State declared a disaster zone.
- Super Storm Sandy, which in late October 2012 wreaked havoc on parts of the U.S East Coast—particularly in New Jersey and New York—caused more than 125 deaths and about $62 billion in damage and other losses in the United States.
Just as climate change has impacted the history of economic and social development, the transportation network—and the access it provides (or fails to provide)—also influences these development processes. The transportation network (and other systems) must, therefore, be prepared to adapt to such severe weather conditions that may be expected to occur in the future. As discussed in an article contained in Transportation Research Board (TRB) Circular E-C152: Adapting Transportation to the Impacts of Climate Change,"40 regional metropolitan planning organizations (MPOs) and State and local departments of transportation (DOTs) will need to consider appropriate near-term operational approaches and long-term planning processes to adapt to the changes in the transportation network resulting from global warming, and to minimize the potential impacts on the transportation system from climatic changes, either through decreasing the system's vulnerability, increasing its resilience, or some combination.
A TRB report41 identifies several conditions resulting from climate change that are of particular importance for the transportation system in the United States. TSM&O strategies will increasingly be needed to help adapt to these events as summarized in Table 4 (with the first two columns taken directly from the TRB Report).
Table 4. Potential Climate Change Impacts on Transportation Infrastructure
| Climate Change |
Impacts on Transportation |
Operations Considerations |
| Increases in very hot days |
- Softening and buckling of pavements
- Thermal expansion of bridge expansion joints
- Rail-track deformities
- Limitations on periods of construction activity due to health and safety concerns
- Vehicle overheating (resulting in roadway incidents)
|
- Reduced (and variable) speed limits (via ATM)
- Truck restrictions
- Road and transit diversions
- Work zone management (accommodate additional lane closures)
- Increase in incident management activities
|
| Rising sea levels |
- Flooding of coastal roads, tunnels, and rail lines
- Erosion of road base and bridge supports (scouring)
|
- Road and lane closures
- Disruption of transit service
- Road and transit diversions
|
| Increases in intense precipitation events |
- Increases in weather-related delays and traffic disruptions
- Increased incidents
- Erosion of road base and bridge supports (scouring)
|
- Reduced (and variable) speed limits (via ATM)
- Road and lane closures
- Truck restrictions
- Diversions via ICM
- Increase in incident management activities
|
| Increases in drought conditions for some regions |
- Increased susceptibility to wildfires and reduced visibility
|
- Reduced (and variable) speed limits via ATM
- Road closures
- Diversions via ICM
- Increase in incident management activities
|
| Increases in hurricane intensity |
- More frequent and potentially more extensive emergency evacuations
|
- Contra-flow lane operations
- Ramp management and closures
- Integrated Corridor Management (along evacuation routes)
|
An underlying element in all of the operational considerations and strategies shown in Table 4 is that of traveler information, providing real-time information to travelers about the on-going transportation impacts and how they may affect their travels, and warning them as to any changes to the norm (e.g., reduced speed limits and closed lanes), thus allowing travelers to make better decisions about how they travel (mode), when they travel (time), where and whether they travel (location), and which route they travel (path). In addition, given the broad geographical range of climate change impacts, operational solutions for reducing transportation impacts need to be addressed on a regional basis.
As climate change continues increasingly to impact the transportation network, incorporating weather-related data, as well as information on the condition of the transportation infrastructure, into the automated and predictive algorithms and related decision-support tools for operations will become even more important. Table 5 identifies some of the existing and emerging technologies and algorithms for collecting real-time data on weather and monitoring infrastructure conditions.
Table 5. Technologies and Algorithms for Monitoring Transportation Infrastructure
- Environmental sensor station (ESS)
A roadway location with one or more fixed sensors measuring atmospheric, pavement and/or water level conditions.
- Atmospheric data include air temperature and humidity, visibility distance, wind speed and direction, precipitation type and rate, and air quality.
- Pavement data include pavement temperature, pavement freeze point, pavement condition (e.g., wet, icy, and flooded), pavement chemical concentration, and subsurface conditions (e.g., soil temperature).
- Water level data can also include levels of streams, rivers and lakes near roads.
|
- Bridge scour monitoring
Bridge scour is the removal of soil, sand, and rocks form around bridge foundations, compromising the integrity of the structure. It is a common cause of bridge failure in the United States. Increased intensity of precipitation events may increase scouring and potential failures
|
The ITS infrastructure itself, including transportation management centers, may also need to be hardened (e.g., remote backup servers, battery backup for key signage along the roadway, and backup communications to such signage) so the technologies can continue to function during and immediately after severe weather events. The period immediately after a severe weather event—when residents want to get back to their homes and resume work—may be the most crucial so that some degree of normalcy (a form of livability, perhaps) can be achieved as soon as possible.
Real-time weather and infrastructure-condition information will also need to be shared among the appropriate agencies involved in operating the transportation system (e.g., TMC) and in responding to an extreme weather event (e.g., the emergency operations center), to aid in the decision-making processes. Given recent climate trends, the interdependencies among the activities are likely to increase and thus be less appropriate for an ad hoc approach. The establishment and use of interagency standard operation procedures may support the sharing of time-sensitive data.
An on-going initiative of FHWA for several years has been the integration and shared use of road weather information system (RWIS) data. Specific programs and activities include:42
- The Clarus System is designed to enable various public agencies to more accurately assess weather and pavement conditions as well as their impacts on operations. Such knowledge is critical for planning, conducting, and evaluating the effectiveness of activities such as winter road maintenance, weather-responsive traffic management, traveler information dissemination, safety management, transit vehicle dispatching, and flood control.
- Research on the feasibility of using vehicles as mobile meteorological sensor platforms.
- RWIS environmental sensor station (ESS) siting guidelines for the roadway environment to enhance observation capabilities.
- Maintenance decision support system (MDSS) tool that integrates relevant road weather forecasts, coded maintenance rules of practice, and maintenance resource data to provide winter maintenance managers with recommended road treatment strategies.
- Human factors analysis of road weather advisory and control Information in order to identify traveler requirements for weather information (both pre-trip and en route) and determine the most effective messages and methods for communicating road weather information.
- Integrating weather into traffic management center operations, including a self-assessment guide to help TMCs evaluate their weather information integration needs and assist them in creating a plan to meet those needs.
These road weather management activities can also support environmental sustainability. Examples from the FHWA ITS benefits database (www.itskrs.its.dot.gov/benefits) include:
- Evaluation data shows that anti-icing and pre-wetting strategies can reduce sanding applications by 20 to 30 percent, decrease chemical applications by 10 percent, and reduce chloride and sediment runoff in local waterways.
- Winter maintenance personnel indicated that RWIS decreased salt usage and anti-icing techniques limited damage to roadside vegetation, groundwater, and air quality (where abrasives are applied).
Performance Measurement
"Sustainability is the next great game in transportation. The game becomes serious when you keep score."
Greenroads (www.greenroads.org).
Score keeping may very well start relatively soon. The Moving Ahead for Progress in the 21st Century (MAP-21) legislation addresses performance measures. Relevant requirements include:
- Goals to be established for environmental sustainability (along with safety, infrastructure condition, congestion reduction, system reliability, freight movement and economic vitality, and reduced project delivery delays).
- USDOT to develop performance measures with States, MPOs, transit agencies and stakeholders, with FHWA promulgating performance measures and standards by April 1, 2014.
- States and MPOs required to set performance targets and annually report on their progress toward meeting those targets.
Performance measures are indicators that provide the basis for evaluating the transportation system operating conditions and identifying the location and severity of congestion and other problems. Increased customer expectation and public sector accountability have helped to focus attention on performance measurement as one of the essential tools of transportation management. In essence, if you don't measure results, you can't tell success from failure; if you can't see success, you can't reward it; and if you can't see failure, you can't correct it.
Previous modules have addressed potential performance measures for the area being addressed in the specific module. Performance measures for sustainable transportation and livability will by definition be cross-cutting, addressing mobility and reliability indicators (as part of economic sustainability), safety and multimodal indicators (as part of social sustainability), as well as environmental (and other) indicators that are not necessarily addressed in other modules. One example of goals, objectives, and indicators for the economic, social, and environmental dimensions of sustainable transportation, as well as good governance and planning, is provided in Table 6.43
Another scorecard for measuring was launched by FHWA in October 2012—the Infrastructure Voluntary Evaluation Sustainability Tool (INVEST), for integrating sustainability best practices into transportation projects and programs.44 In the context of INVEST, a sustainable highway should satisfy the functional requirements of societal development and economic growth while striving to enhance the natural environment and reduce consumption of natural resources. The sustainability of a highway should be considered throughout the project lifecycle—from conception through construction and maintenance and operation.
INVEST is a Web‐based, self‐evaluation tool (available at www.sustainablehighways.org****) that helps transportation professionals learn about sustainability principles and the FHWA Sustainable Highways Initiative; browse sustainable highway best practices and criteria; and evaluate or score projects using different scorecards based on project type and location. INVEST includes a manual of goals and criteria addressing the full lifecycle of a project, including system planning (SP), project development (PD), and operations and maintenance (OM). Each criterion describes a particular practice, provides methods for implementing it, and includes typical sources of documentation of practices. Several of the criteria are directly related to TSM&O strategies and ITS technologies as described in this ePrimer. For example:
- SP-9: Travel Demand Management - Points given for implementing TDM strategies (e.g., pricing, and transportation management organization) and for quantifiable TDM performance measures).
- SP-14: Transportation Systems Management and Operations - Points given for developing a TSM&O plan and incorporating them into the Long Range Transportation Plan, for implementing TSM&O strategies (the more strategies, the more points), and for quantifiable TSM&O performance measures.
- PD-14: ITS for System Operations - Implementation of one or more applications (e.g., emergency management, traveler information, communications backbone, lane management such as variable speed limits and lane assignment via ATM, road weather management, surveillance, traffic signal control, and incident management), with the number of points dependent on the number of strategies installed.
- PD-17: Energy Efficiency - Includes the energy consumption of lighting fixtures and ITS devices.
- OM-11: Traffic Control Infrastructure Maintenance - Points awarded for the preservation and maintenance of permanent traffic control, ITS, and safety devices.
- OM-12: Road Weather Management Program - While ITS-related solutions are not included in this criterion, points are awarded for a program that includes strategies to mitigate the impacts of various weather scenarios (i.e., adaptation plans).
Table 6. Key Sustainable Transportation Goals, Objectives, and Performance Indicators43
|
Objectives |
Performance Indicators |
| I. Economic |
| Economic productivity |
Transport system efficiency.
Transport system integration.
Maximize accessibility.
Efficient pricing and incentives. |
- Per capita GDP
- Portion of budgets devoted to transport.
- Per capita congestion delay.
- Efficient pricing (road, parking, insurance, fuel, etc).
- Efficient prioritization of facilities
|
| Economic development |
Economic and business development |
- Access to education and employment opportunities.
- Support for local industries.
|
| Energy efficiency |
Minimize energy costs, particularly petroleum imports. |
- Per capita transport energy consumption
- Per capita use of imported fuels.
|
| Affordability |
All residents can afford access to basic (essential) services and activities. |
- Availability and quality of affordable modes (walking, curling, ridesharing and public transport).
- Portion of low-income households that spend more than 20% of budgets on transport.
|
| Efficient transport operations |
Efficient operations and asset management maximizes cost efficiency. |
- Performance audit results.
- Service delivery unit costs compared with peers.
- Service quality.
|
| II. Social |
| Equity / fairness |
Transport system accommodates all users, including those with disabilities, low incomes, and other constraints. |
- Transport system diversity.
- Portion of destinations accessible by people with disabilities and low incomes.
|
| Safety, security and health |
Minimize risk of crashes and assaults, and support physical fitness. |
- Per capita traffic casualty (injury and death) rates.
- Traveler assault (crime) rates.
- Human exposure to harmful pollutants.
- Portion of travel by walking and cycling.
|
| Community development |
Help create inclusive and attractive communities. Support community cohesion. |
- Land use mix.
- Walkability and bikeability
- Quality of road and street environments.
|
| Cultural heritage preservation |
Respect and protect cultural heritage. Support cultural activities. |
- Preservation of cultural resources and traditions.
- Responsiveness to traditional communities.
|
| III. Environmental |
| Clunate stability |
Reduce global warming emissions
Mitigate climate change impacts |
- Per capita emissions of greenhouse gases (CO2, CFCs, CH4 etc.).
|
| Prevent air pollution |
Reduce air pollution emissions
Reduce exposure to harmful pollutants. |
- Per capita emissions (PM, VOCs. NOx, CO, etc.).
- Air quality standards and management plans.
|
| Prevent noise pollution |
Minimize traffic noise exposure |
|
| Protect water quality and minimize hydrological damages. |
Minimize water pollution.
Minimize impervious surface area. |
- Per capita fuel consumption.
- Management of used oil, leaks and stormwater.
- Per capita impervious surface area.
|
| Openspace and biodiversity protection |
Minimize transport facility land use.
Encourage more compact development.
Preserve high quality habitat. |
- Per capita land devoted to transport facilities.
- Support for smart growth development.
- Policies to protect high value farmlands and habitat.
|
| IV. Good Governance and Planning |
| Integrated, comprehensive and inclusive planning |
Clearly defined planning process.
Integrated and comprehensive analysis.
Strong citizen engagement.
Lease-cost planning (most beneficial solutions are selected and funded). |
- Clearly defined goals, objectives and indicators.
- Availability of planning information and documents.
- Portion of population engaged in planning decisions.
- Range of objectives, impacts and options considered.
- Transport funds can be spent on alternative modes and demand management if most beneficial overall.
|
- OM-13: Transportation Management and Operations - Points awarded for the preservation and maintenance of permanent traffic control and ITS devices and systems. The intent of this criterion is to encourage active management of vehicles within the existing roadway infrastructure to alleviate the major causes of congestion resulting from: insufficient capacity (bottlenecks); substandard transportation operations systems (such as traffic signal systems with poor signal timing); incidents (crashes, disabled vehicles), weather (snow, ice, fog); work zones; and nonrecurring events (special events).
Sustainable Funding
While not part of the triple bottom line of sustainability, the combined efforts to reduce GHG emissions—through more fuel-efficient vehicles, electric vehicles (EVs), reduced VMT, and improved operations—has been good for the environment. These efforts, however, have not been so good for the primary source of funding for transportation improvements.
Much of the revenue required to preserve, maintain, manage, and operate the nation's transportation system comes from State and Federal fuel taxes, which are typically paid at the time of purchase based on the amount of fuel consumed by motorists. The Federal fuel tax is 18.4 cents per gallon for gasoline and 24.4 cents per gallon for diesel—and has been at these rates since 1993. The States currently add an average of approximately 30 cents per gallon, with the actual amount varying by State.
As previously noted, over the past several years, vehicles have become more fuel-efficient. Moreover, vehicles have been introduced that utilize alternate fuels (other than gasoline or diesel) and means of propulsion, such as EVs and plug-in hybrid electric vehicles (PHEV)—a trend that is expected to continue and perhaps even accelerate over the next decade. The users of these more fuel-efficient and alternative-fuel vehicles have been paying less fuel tax than previous vehicle fleets for the same number of miles driven, with electric vehicles paying no fuel taxes. The situation has been further exacerbated by major increases in fuel prices, which tend to reduce the total number of miles driven. As a result, fuel tax receipts have not kept up with the transportation funding needs, even though the driving population has increased. This overall funding gap—at both the State and Federal levels—can only be expected to grow as the average fuel economy of the vehicle fleet increases.
A range of vehicle fleet forecast scenarios for Oregon45 illustrates the implications of these current fuel consumption trends on fuel tax revenues. Figure 7 shows the average cents paid per vehicle mile driven for different forecast scenarios. Each scenario involves a distinct combination of forecasted sales and ownership of various vehicle types and fuel efficiency within Oregon. These forecasts were based on recent literature on the subject and utilized the Oregon Department of Transportation Greenhouse Gas Statewide Transportation Emissions Planning Model (GreenSTEP). The scenario labels specify the assumptions made about the average vehicle in three technology categories:
- Tech represents the vehicle sales of EV/PHEV technology-based vehicles. Four categories were developed with:
- low - representing minimal market penetration of EVs/PHEVs due to costs, no major breakthrough in battery technology, and increased efficiency of ICE; and
- very high - representing the other end of the EV/PHEV market-penetration spectrum, in which EVs and PHEVs become the dominant vehicle type on the road.
- Miles-per-gallon represents the average miles per gallon for ICE and hybrid vehicles ranging from:
- very low (i.e., average of 24.9 mpg in 2015, increasing to 40.5 mpg by 2035) to
- high (i.e., average of 44.7 mpg in 2015 and 46.9 mpg in 2035) - The high miles-per-gallon scenario assumes a significant influx of engine start/stop and similar technologies in the next few years.
As can be seen from Figure 6, despite which future scenario occurs, fuel tax revenues will continue to decline in the future with the worst-case scenario in this regard being the Very High Tech in which the majority of vehicles will be EVs and PHEVs that will pay no (or minimal) fuel tax to support the operation and maintenance of the roadways they are using. This trend occurs even though VMT are flat or increasing in every year through 2035 in this forecast.
Figure 6. State and Federal Fuel Taxes on Light Duty Vehicles per Vehicle Mile Traveled
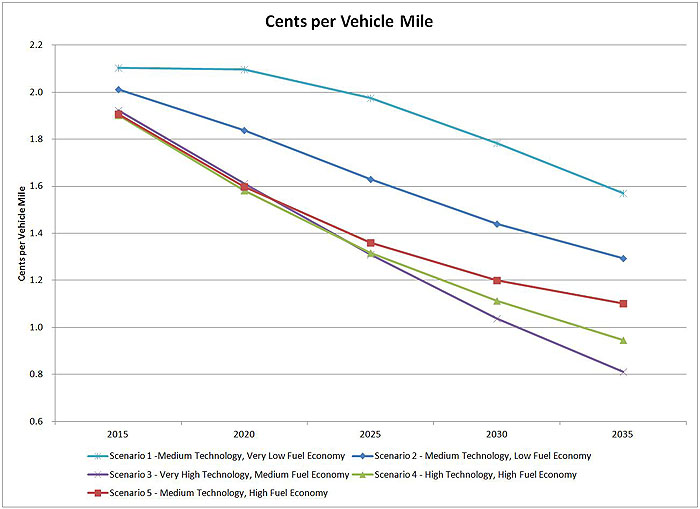
(Extended Text Description: This is a line graph to depict the state and federal fuel taxes on light duty vehicles per vehicle mile traveled. The graph is labeled at the top "Cents per Vehicle Mile." The x-axis has the yearly values of 2015, 2020, 2025, 2030, 2035. The y-axis has the values for cents per vehicle mile: 0.6, 0.8, 1.0, 1.2, 1.4, 1.6, 1.8, 2.0, 2.2. The first data line represents Scenario 1 - Medium Technology, Very Low Fuel Economy: begins at 2.1 in 2015 and general declines to just under 1.6 by 2035. The second data line represents Scenario 2 - Medium Technology, Low Fuel Economy: begins at 2.0 in 2013 and generally declines to 1.3 in 2035. The third line represents Scenario 3 - Very High Technology, Medium Fuel Economy: begins at 1.9 in 2015 and generally declines to 0.8 by 2035. The fourth data line represents Scenario 4 - High Technology, High Fuel Economy: begins at 1.9 in 2015 and generally declines to just below 1.0 in 2035. The final data line represents Scenario 5 - Medium Technology, High Fuel Economy: begins at 1.9 in 2015 and generally declines to 1.1 by 2035.)
Among policymakers and industry analysts across the nation, a growing consensus has emerged that a fuel consumption-based tax can no longer be relied upon to provide sustainable revenues to maintain and operate the nation's transportation infrastructure; that the nation needs a new paradigm for transportation funding. Several studies conclude that a road usage charge based directly on miles traveled (alternatively known as a mileage-based user fee,
MBUF, or a mileage tax) is one of the leading options.†††† Any such road usage charge will require ITS-based technology, including vehicle telematics and enhanced standards. Additional information on MBUF is provided in Module 8.
There is also the issue of fairness—a form of social sustainability—that all users of the roadway should pay their fair share based on their use of the transportation network, and contribute to the management and operation of the roadways, including reduced congestion (which their driving helps to create) and enhanced safety as provided by ITS.
Return to top ↑
The Future
Several potential (and in some cases likely) future scenarios have already been noted, including increased use of alternative fuel vehicles (e.g. electric) that have no emissions at all (although there is still a carbon footprint associated with EVs in terms of the power plant that produces the electricity for the charging station); and the possibility of using the GHG reductions from TSM&O and ITS technologies as offset credits under a cap-and-trade program, thereby providing another funding source. Research is continuing on eco-driving and dynamic intervention.46, 47
As discussed in other modules, it is envisioned that the connected vehicles program will greatly enhance mobility and safety (which are part of a sustainable transportation network). Connected vehicles will also contribute to environmental sustainability through in-vehicle display to further promote eco-driving and eco-routing and by providing real-time environmental data from the vehicle to support real-time operations and performance measurement.
Collecting data on vehicle emissions can be problematic. Criteria pollutants are monitored through a wide network of State and local ambient monitoring stations (SLAMS) and other networks, all under EPA oversight. The ability to discern from the data how much reduction in criteria pollutants is directly attributable to TSM&O strategies is problematic at best. Moreover, the information is not available in real time.
Greenhouse gases (GHGs)—particularly carbon dioxide—pose even a greater difficulty in this regard. Some of this chemical stays on the ground, some is used by plants as part of the photosynthesis process, some makes its way into the atmosphere where it contributes to the warming of the earth's surface reducing outward radiation, and some makes it way to bodies of water where it dissolves to form carbonic acid. All of the previous examples of how TSM&O and ITS can reduce CO2 emissions were based on models and other analysis tools—not on direct measurements.
This is being addressed as part of the RITA, ITS-JPO Program: Applications for the Environment: Real-Time Information Synthesis (AERIS). The objective of the AERIS research program48 "is to generate and acquire environmentally relevant real-time transportation data, and use these data to create actionable information that support and facilitate 'green' transportation choices by transportation system users and operators. Employing a multi-modal approach, the AERIS program will work in partnership with the vehicle-to-vehicle (V2V) communications research effort to better define how connected vehicle data and applications might contribute to mitigating some of the negative environmental impacts of surface transportation."
Having vehicle emissions data in real time offers many exciting prospects for how the transportation network might be managed and operated. For example:
- Driver feedback to promote eco-driving practices, including mentioning eco-approach and departure at signalized intersection applications and dynamic eco-routing applications based on real-time traffic and emissions data.
- Dynamic low emission zones including variable boundaries incentive-based strategies.
- Variable pricing (e.g., HOT lanes) based on emissions.
- Changing TSM&O parameters in real time (e.g., signal timing, variable speed displays, ramp metering rates, and integrated corridor management strategies) based on emissions data—for example, a Code Red Air Quality Day.
Return to top ↑
Summary
The aforementioned FHWA Primer on "The Role of Transportation Systems Management & Operations in Supporting Livability and Sustainability" highlights nine key elements—fundamentals—for managing and operating transportation systems in ways that support livability and sustainability. These fundamentals are:
- Operate to serve community priorities - The choice and implementation of M&O strategies should respond to community priorities, reflecting the community's goals and objectives for the transportation system and its larger context as expressed through the planning process. These goals provide the basis for judging what is considered successful operation of the transportation system. By focusing on community priorities, transportation system operations can help a community achieve its broader goals.
- Increase opportunities for safe, comfortable walking and bicycling (e.g., signal timing and countdown signals).
- Improve the transit experience by increasing the attractiveness and performance of public transit (e.g., transit signal priority, bus lanes and use of shoulders, and integrated real-time information).
- Support reliable, efficient movement of people and goods (i.e., manage congestion and improve reliability, thereby helping to avoid the need for major capacity expansions that are costly and may not fit within community visions).
- Manage travel demand.
- Provide information to support choices (e.g., integrated corridor management).
- Support place making so as to emphasize the connections between land use and transportation, as well as urban design and operations; using context-sensitive solutions that integrate transportation, building, and landscape design to create a sense of place.
- Use balanced performance measures that consider the transportation network on the full range of and sustainability outcomes (e.g., social equity, economic impacts, and environmental quality).
- Collaborate and coordinate broadly, carefully balancing the needs of multiple segments of a population in the current generation as well as future generations to ensure a healthy, vibrant quality of life for all.
As discussed throughout this module, transportation systems management and ITS technologies will play a critical role in nearly all of these elements, as well as supporting efforts to adapt to a changing climate and promote financial sustainability for the transportation network.
Finally, environmental sustainability is as much a policy issue as a technical issue. The policy considerations are beyond the scope of this document; but the reader might wish to check out a presentation‡‡‡‡ by the executive director of the nonpartisan Georgetown Climate Center that provides a State and Regional Overview of Climate Change.
Return to top ↑
References
Return to top ↑