ITS ePrimer
Module 7: Public Transportation
Authored by Carol L. Schweiger, President, Schweiger Consulting LLC, Boston, MA, USA
2016
Table of Contents
Purpose
Intelligent transportation systems (ITS) offer a broad range of technologies to improve operational efficiency, customer service and convenience, safety and security, and overall management in public transportation. Further, ITS provides opportunities to more easily analyze critical performance data as well as facilitate coordination and cooperation among multiple transit providers in a region, and enhance multimodal transportation. Finally, public transit ITS supports the transit Connected Vehicle Program bundle (Integrated Dynamic Transit Operations) by providing the related applications, specifically T-DISP (dynamic transit operations) and T-CONNECT (connection protection). Thus, the purpose of this module is to describe public transportation technologies; their application to and impact on transit operations, customer service and management; and their abilities to facilitate and encourage multimodal travel.
Return to top ↑
Objectives
The learning objectives for this module are as follows:
- Understand public transportation technologies, how they function, and how they can be applied to facilitate or improve operations, customer service, and management;
- Recognize the dependencies among specific technologies;
- Understand the relationship between non-transit (e.g., highway-related) and transit technologies; and
- Realize the potential of transit ITS technologies to facilitate multimodal travel.
Return to top ↑
Introduction
The U.S. Department of Transportation (USDOT) classifies public transportation in a variety of ways. The method used in this module to categorize transit ITS is by function within a transit organization, as follows:
- Fleet Operations and Management - covers technologies that are implemented to facilitate transit operations and provide input to senior management in terms of overall system performance;
- Traveler Information - covers the customer-facing technologies that provide the public with information regarding trip planning and real-time operational information;
- Safety and Security - covers those technologies that improve the safety and security of transit staff and passengers through on-board and facility technologies;
- Automated Fare Payment - covers fare collection and payment technologies, including fare media and mobile payment applications;
- Maintenance - covers technologies that facilitate maintenance activities, such as engine and vehicle component monitoring and tracking of scheduled and unscheduled maintenance activities and inventory systems; and
- Other - covers a variety of other technologies and systems that do not fit into the other categories, such as data management and the use of open data.
This module discusses technologies in these six major categories that cover fixed-route, paratransit and flexibly routed services, as follows:
- Fleet Operations and Management:
- Communications technologies
- Automatic vehicle location (AVL)
- Computer-aided dispatch (CAD)
- Automatic passenger counters (APCs)
- Scheduling (fixed-route and paratransit) systems
- Transfer connection protection (TCP)
- Transit signal priority (TSP)
- Yard management
- Intelligent vehicle technologies (e.g., collision warning and precision docking)
- Lane control technologies
- Traveler Information:
- On-board automated voice announcements (AVA)
- En-route/wayside traveler information, including real-time arrival/departure information in a variety of dissemination media
- On-board Internet access for passengers
- 511, 311, and 211 systems, and Google Transit
- Third-party smartphone applications
- Safety and Security:
- Mobile (on-board and exterior) and fixed video surveillance
- Covert emergency alarm and covert live audio monitoring
- On-board digital video recorders
- G-force monitoring
- Automated Fare Payment:
- Automated fare media (e.g., magnetic stripe cards, contact smartcards, contactless smartcards and mobile payment methods)
- Automated fareboxes and faregates
- Ticket vending machines
- Maintenance:
- Engine and drivetrain systems monitoring
- Maintenance software to schedule and track scheduled and unscheduled maintenance activities, and manage parts inventory
- Other:
- Data management and reporting
- Technology integration
- Geographic information system (GIS) application
- Service coordination facilitated by technology
- Open data for third-party application development
Figure 1 shows the deployment trends for some of the most prevalent transit technologies from 1997 to 2010. Four major trends are displayed in this figure: percent of fixed-route vehicles equipped with automatic vehicle location (AVL), percent of fixed-route buses with electronic real-time monitoring of system components, percent of demand responsive vehicles that operate using computer-aided dispatch (CAD), and percent of transit stops with an electronic display of dynamic traveler information to the public.
Figure 1. Transit ITS Deployment Status (1997-2010)1
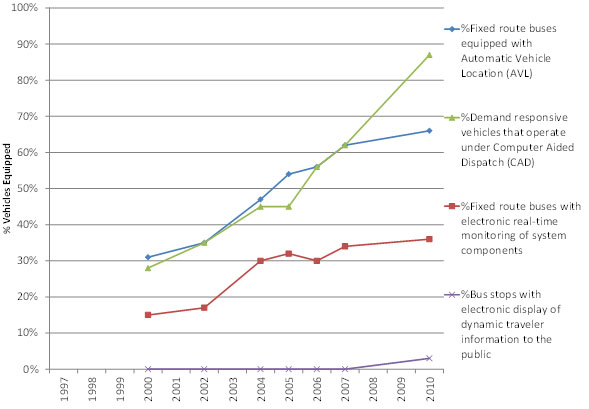
(Extended Text Description: This line graph shows the Transit ITS Deployment trends from 1997-2010. The x-axis represents the year in which the data was accumulated, going from 1997 to 2010. The y-axis represents the percentage of vehicles equipped, with measurements ranging from 0% where the two axes meet, to 100% in 10% intervals. The trending for four types of vehicles are represented on this graph. The following data points are represented as estimated trends - the original data is not available. The first vehicle trend is the percentage of fixed route buses equipped with Automatic Vehicle Location (AVL). This trend is noted in blue beginning at 30% in 2000. There is a fairly consistent upward trend for this vehicle type all the way through 2010, when it reached between 60-70% vehicles equipped. The second trend noted in green is the percentage of demand responsive vehicles that operate under Computer Aided Dispatch (CAD). Beginning in 2000 at just under 30% vehicles equipped, trended upward, with a brief plateau in 2005 between 40-50% before experiencing rapid growth to just under 90% vehicles equipped by 2010. The third trend noted in red is the percentage of fixed route buses with electronic real-time monitoring of system components. Beginning in 2000 with between 10-20% vehicles equipped, this vehicle type had an aggressive rise to 30% in 2004 before experiencing a gentler upward trend to between 30-40% by 2010. The final vehicle trend, noted in purple, is the percentage of bus stops with electronic display of dynamic traveler information to the public. Starting at 0% in 2000, this vehicle type began to take off in 2007, reaching between 0-10% vehicles equipped by 2010. Additional Author notes: This figure shows the deployment trends for some of the most prevalent transit technologies from 1997 to 2010. Four major trends are displayed in this figure: percent of fixed-route vehicles equipped with automatic vehicle location (AVL), percent of fixed-route buses with electronic real-time monitoring of system components, percent of demand responsive vehicles that operate using computer-aided dispatch (CAD), and percent of transit stops with an electronic display of dynamic traveler information to the public.)
Figure 2 shows an example of the relationships among various transit ITS technologies at a central/dispatch location, and Figure 3 shows an example of the relationships on board a vehicle.
Figure 2. Example of Central System Technology Relationships
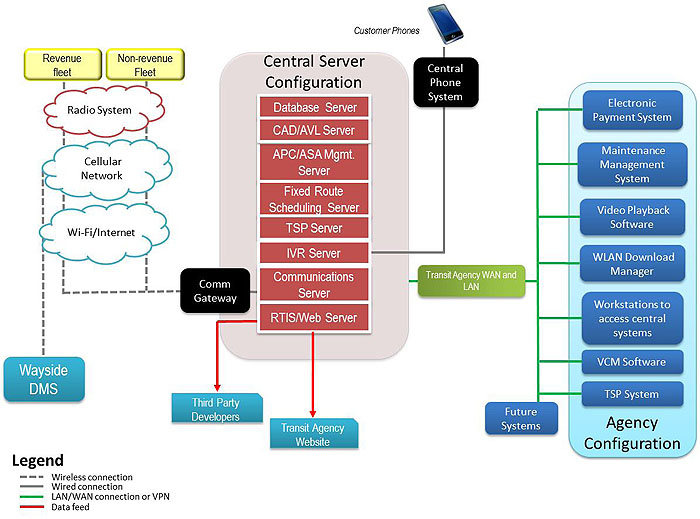
(Extended Text Description: This graphic shows the relationships among various Central System Technologies. Beginning in the center of the graphic, there is a red rectangular column representing the Central Server Configuration. In this column the following servers are represented in individual blocks from top to bottom: Database Server, CAD/AVL (Computer Aided Dispatch and Automatic Vehicle Location) Server, APC/ASA Mgmt. Server, Fixed Route Scheduling Server, TSP Server, IVR Server, Communications Server, and RTIS/Web Server. From the IVR Server, there is a gray line representing a wired connection that leads to a black box labeled "Central Phone System" with a smart phone icon above it. From the RTIS/Web Server, a red line representing data feed points down to a blue box labeled "Transit Agency Website." Coming from the left side of the RTIS/Web Server is another line pointing to blue box labeled "Third Party Developers." From the left side of the Communications Server, there is a dotted gray line that goes to a black box labeled "Comm Gateway" and branches upwards through three cloud networks (bottom to top: the Wi-Fi/Internet, Cellular Network, and Radio systems), going on to two separate yellow boxes. These boxes are labeled "Revenue Fleet" and "Non-revenue Fleet." From the Cellular network cloud, there is another dotted gray line going downwards representing the wireless connection to the Wayside DMS. Coming from the entire Central Server Configuration, there is a solid green line representing the LAN/WAN connection or VPN. This line goes through a light green box labeled "Transit Agency WAN and LAN" and branches out to a light blue section identified as the "Agency Configuration." Within the "Agency Configuration," the following items are represented in individual dark blue boxes (top to bottom): Electronic Payment System, Maintenance Management System, Video Playback Software, WLAN Download Manager, Workstations to access central systems, VCM Software, and TSP System. Outside the "Agency Configuration," the LAN/WAN connection also leads to a dark blue box labeled as "Future Systems.")
Source: Courtesy TranSystems Corporation.
Figure 3. Example of On-Board Technology Relationships
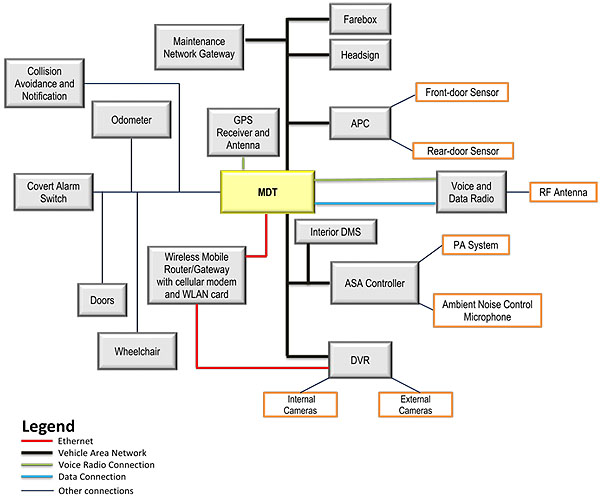
(Extended Text Description: This graphic shows an example of the relationships among various ITS technologies onboard a vehicle. In the center of the diagram is a box labeled MDT (Mobile Data Terminal). Coming from the top of MDT, is a box labeled "GPS Receiver and Antenna" connected via a voice radio connection. Connected to the MDT via a vehicle area network are the Maintenance Network Gateway, farebox, headsign and APC. The APC is connected to the front-door sensor and rear-door sensor via an alternative link. Utilizing both a Voice Radio Connection and a Data Connection, the MDT is connected to the Voice and Data Radio. This is then connected to the RF antenna. Connected by another vehicle area network are the Interior DMS, the ASA Controller, and the DVR. The ASA controller is then connected to the PA System and Ambient Noise Control Microphone. The DVR is connected to internal and external cameras. Coming from the bottom of the MDT rectangle is a red line representing an Ethernet link. This link connects a Wireless Mobile Router/Gateway with cellular modem and WLAN card. This link continues and also connect to the DVR. To the left, the MDT is also connected to the following: Collision Avoidance, Odometer, Covert Alarm Switch, Doors, and Wheelchair.)
Source: Courtesy TranSystems Corporation.
In order to provide a further, general understanding of how these technologies are related to each other, Table 1 shows the dependencies among the technologies.
Table 1. Dependencies Among Transit ITS Technologies
| Category |
System/Technology |
Dependent on |
| Fleet Operations and Management |
Communications technologies |
Public/private voice and data communication backbones |
| Computer-aided dispatch (CAD) |
- Voice and data communications technologies
- Automatic vehicle location (AVL) system
- Route and vehicle schedule data
|
| Automatic vehicle location (AVL) |
- Data communications technologies
- Global positioning system (GPS) or other location enabling technologies, such as Wi-Fi
|
| Automatic passenger counters (APCs) |
- AVL system
- Route and vehicle schedule data
|
| Scheduling (fixed-route and paratransit) systems |
Stop database (contains data such as stop name, location, routes that stop at this stop, direction of travel from this stop, list of amenities available at this stop) |
| Transfer connection protection (TCP) |
|
| Transit signal priority (TSP) |
- AVL system
- CAD system (when TSP used based on schedule adherence status)
- Roadside signal infrastructure
|
| Yard management |
Indoor positioning systems (e.g., radio frequency identification [RFID]-based, Wi-Fi-based) |
| Intelligent vehicle technologies (e.g., collision warning and precision docking) |
Varies by technology application and deployment |
| Lane control technologies |
- AVL system
- CAD
- Virtual mirror
- Lane guidance systems
- Roadside signal infrastructure
|
| Traveler Information |
On-board automated voice announcements (AVA) |
- AVL system
- Route and vehicle schedule data
|
| En-route/wayside traveler information, including real-time arrival/departure information in a variety of dissemination media |
- Route and vehicle schedule data
- AVL system
- CAD system
- Data communications technologies
|
| On-board Internet access for passengers |
Data communications technologies |
| 511, 311, and 211 systems, and Google Transit |
Open data |
| Third-party smartphone applications |
Open data |
| Safety and Security |
Fixed video surveillance |
Data communications technologies |
| Covert emergency alarm and covert live audio monitoring |
- Voice and data communication technologies
- CAD system
- AVL system
|
| On-board digital video surveillance |
No dependence on other systems |
| G-force monitoring |
AVL system |
| Automated Fare Payment |
Automated fare media (e.g., magnetic stripe cards, contact smartcards, contactless smartcards and mobile payment methods) |
Fare media processing units |
| Automated fareboxes |
No dependence on other systems |
| Automated faregates |
Data communications technologies |
| Ticket vending machines (TVMs) |
Data communications technologies |
| Maintenance |
Engine and drivetrain systems monitoring |
OBD-II* or Society of Automotive Engineers (SAE) J1708/J1939 compatibility of on-board computers within engine and drivetrain |
| Maintenance software to schedule and track scheduled and unscheduled maintenance activities, and manage parts inventory |
No dependence on other systems |
| Fuel Management System |
No dependence on other systems |
| Other |
Enterprise database/ datawarehouse and reporting |
- Open databases
- Data dictionary
|
| Technology integration |
Multiple dependencies** |
| Geographic information system (GIS) application |
Spatial data recording and management systems |
| Service coordination facilitated by technology |
- CAD/AVL systems shared across participants
- Voice and data communications technologies
|
| Open data for third-party application development |
Standard format for data such as General Transit Feed Specification (GTFS) and GTFS-real time |
* OBD-II is a standard that monitors engine, chassis, body, and accessory devices in a vehicle.
** To be defined later in this module.
Return to top ↑
Fleet Operations and Management
Communications Technologies
Communication technologies depend on the infrastructure and devices that are used to transmit voice and data. The infrastructure is absolutely critical to the integration and implementation of specific transit technology applications, such as AVL and en-route/wayside traveler information. Communication systems provide critical links among drivers, dispatchers, emergency response, customers, and other personnel involved in transit.
Transit communication technologies range from voice radio to comprehensive systems that combine various communication technologies to allow interaction among a wide range of communication and data systems. Voice, text, and data can be transmitted over radio, cellular, or other wireless networks. More advanced communication systems can be used to transmit text, data, and video. Older generation technologies included radio frequency identification (RFID), infrared, inductive loops, and street-side beacons. Emerging technologies include Wi-Fi mesh networks, Wi-Max, and connected vehicle communications.
As has happened or is happening in other industries, there is a trend to migrate from analog to digital communications in public transportation. Digital communication provides a level of security that is not available with analog, it is less likely to be affected by noise and interference, and it tends to be less expensive than analog communication.
Wireless communication systems provide the operational backbone for many technologies and include the following:
- Wide area wireless (WAW) - communications networks based on radio frequency broadcasting. These networks can be generic or proprietary.
- Wireless local area networks (WLANs) - data communication systems (analogous to a wireless internet connection) that allow transit vehicles to communicate with a base station or vice versa. WLANs are used to upload or download data over the air, eliminating the need to use wired communications. In the transit industry, WLANs are commonly used in garages allowing transit vehicles, as they enter the garage, to transmit data such as passenger counts, as well as to receive on-board data updates (such as for an automated annunciation system).
- Dedicated short-range communications (DSRC) - a beacon/tag combination used in transit signal priority (TSP) systems and toll collection on bridges, tunnels, turnpikes, and parking facilities. The electronic tag, or transponder, contains a small radio transmitter that is used to emit a short-range radio signal that a beacon, or tag reader, receives. The beacon then transmits the data to the necessary computer hardware and software via radio frequency. The short-range radio signals are transmitted at a special frequency designated by the FCC for these short-range communication needs. The tags can be either active or passive.
- Land line and cellular telephone networks; and
- Internet and intranet.
Without the ability to transmit data from a vehicle to dispatch or from one system to another, individual transit technology capabilities are diminished or not functional.
The majority of benefits of communication technologies improve reliability and on-time performance that can lead to increased customer satisfaction. Also, communications systems enhance the safety and security of vehicle operators and travelers through decreased emergency response time and increased visibility into incidents. Communications technologies may not lead to capital cost savings, but operating cost savings are possible if communication systems are used, for example, to improve schedule adherence. Further savings may be possible when communication systems facilitate data exchange or lead to greater coordination with other regional transit/transportation providers.
Figure 4 shows an example of how WLAN is used; when a transit vehicle is near a wireless access point within a garage, data collected on board, such as passenger counts, can be downloaded to a database for future analysis.
Figure 4. Example of WLAN Use
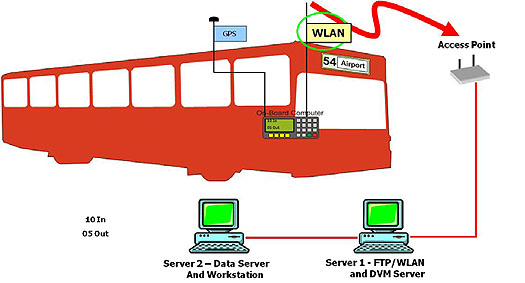
(Extended Text Description: This image shows the red silhouette of a transit vehicle with various signal and computer connections. An icon of an electronic device is placed on the vehicle and labeled "On-Board Computer." A dark gray line connects the device to a GPS. Another dark gray line extends directly above the computer and above the vehicle. On this line is a yellow tag labeled WLAN. From the top of that line, is a curvy red arrow pointing to a small rectangular device labeled "Access Point." From the access point, there is a dark red line that goes through a computer icon labeled "Server 1 - FTP/WLAN and DVM Server" and onto a second computer icon labeled "Server 2 - Data Server and Workstation." To the left of the computers text reads "10 In 05 Out.")
Figure 5 shows an example of the use of DSRC in transit, specifically for TSP.
Figure 5. Example of DSRC Use in Transit
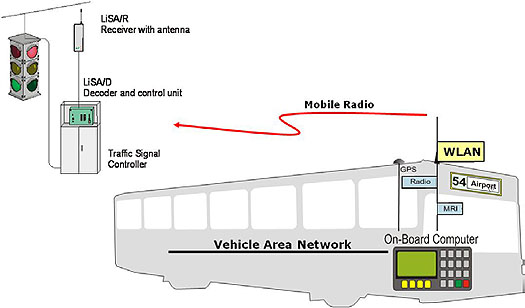
(Extended Text Description: This graphical illustration demonstrates an example of DSRC use in transit. The icon of a bus is overlaid with a long horizontal line labeled Vehicle Area Network, an on-board computer, a GPS antenna, and an antenna with attachments labeled WLAN, Radio, and MRI. A curving red line labeled Mobile Radio points to the icon of a Traffic Signal Controller, connected to a LiSA/D Decoder and control unit, connected to a traffic light and LiSA/R Receiver with antenna.)
The Chattanooga Area Regional Transportation Authority (CARTA) in Chattanooga, TN, "identified four possible approaches to meet its mobile communication needs: 1) an expanded City mobile communications network (if deployed), 2) cellular data communications, 3) extended wireless local area networks (WLANs), and 4) a WLAN at the CARTA garage."2 In 2007, CARTA implemented WLANs communications at both vehicle storage facilities to enable bulk data transfer with vehicles to facilitate their vehicle component monitoring (VCM) system for fixed-route vehicles. The WLAN was also used to download schedules to several onboard systems. Also, in 2007, CARTA deployed an Evolution-Data Optimized (EVDO) network, which provided data communication between CARTA vehicles and CARTA headquarters. And in 2008, CARTA deployed a public website that included bus next-arrival-time predictions based on real-time schedule adherence data gathered from the fixed-route vehicles over the mobile data communications system.
Automatic Vehicle Location (AVL)
"[An] AVL system is defined as the central software used by dispatchers for operations management that periodically receives real-time updates on fleet vehicle locations. In most modern AVL systems this involves an onboard computer with an integrated Global Positioning System (GPS) receiver and mobile data communications capability."3 AVL systems allow transit managers to monitor the actual or approximate location of transit vehicles in their fleet at any given time. AVL, GPS, and dispatching software are independent technologies, not all one and the same. Essential to an AVL system is the on-board computer (known as a mobile data terminal [MDT] or mobile data computer [MDC]) and the means to transmit the data back to a central dispatch location via a communication system for processing, interpretation, and response.
As a backup to GPS-based AVL, dead reckoning uses odometer readings and speed to determine vehicle location. Although AVL systems and related components are usually installed for operational reasons, they can be used for TSP systems and customer information systems.
Computer-aided Dispatch (CAD)
Computer-aided dispatch (CAD) software provides decision-support tools used by transit dispatchers and supervisors to monitor operations in real-time, allowing them to manage the operations proactively (handling delays, disruptions in service, and incidents as they occur). By having the CAD system notify operations staff of problems by exception, it allows staff to focus on areas of concern without the need to personally monitor operations to identify issues. Further, CAD can facilitate the "adjustment of vehicle headways, dispatching replacement or additional vehicles, or reporting incidences."4 The key transit technologies that work hand in hand with CAD are AVL and communication technologies. In fact, most agencies refer to CAD and AVL as a combined CAD/AVL system.
A CAD/AVL system typically provides dispatchers with at least two displays: one that shows the locations of vehicles on a map (from the AVL system) and one that shows a queue of incidents or calls from vehicle operators (from the CAD system). Using these screens together, dispatchers can "identify and respond to problems on their routes. When a [vehicle] operator calls, the dispatcher sees a message showing the [vehicle] number on the CAD screen (which prioritizes the operator calls). The dispatcher selects the vehicle calling from the incident list and refers to their Automatic Vehicle Location screen for its location."4 The CAD/AVL system helps dispatchers track route performance by notifying them of early, late, or off-route buses. Using the communication system (voice or data), dispatchers or supervisors can communicate with vehicles individually, in a specific group (e.g., all buses on Route 5) or with all vehicles.
On board the vehicle, the on-board computer (MDT or MDC) is constantly checking the actual location of the vehicle vs. where the vehicle should be (based on the vehicle’s schedule), resulting in the determination of schedule adherence. When the schedule adherence is outside a specific tolerance (set by the transit agency), this exception condition is reported to a dispatcher. Also, the schedule adherence is displayed for the vehicle operator on a MDT, and AVL data is constantly displayed on the dispatcher’s workstation.
An example of a CAD/AVL system is provided at the end of this module’s subsection.
Table 2 contains the hardware and software associated with a CAD/AVL system.
Table 2. CAD/AVL Components
| CAD/AVL Component |
Hardware/Software |
Comments |
| GPS Receiver and Antenna |
Hardware |
GPS receiver reports date and time, latitude, longitude, speed and direction of travel |
| Schedule Adherence |
Software |
Continuous feedback on current schedule adherence status, updated based on the estimated on-schedule time for the current location and typically displayed to the vehicle operator and dispatcher |
| Route Adherence |
Software |
Computation of whether vehicle is running on-route or off-route. Dispatcher notified when vehicle is determined to have gone off-route or have come back on-route. |
| Mobile Data Terminal (MDT) or Mobile Data Computer (MDC) |
Hardware |
Vehicle operator display that is used for vehicle operator logon/logoff, sending vehicle location reports to dispatch, voice call management, data messaging, display of schedule adherence and integration with other on-board equipment (e.g., farebox, headsigns) |
| Automated Voice Announcements (AVA) - described later in this module |
Hardware and Software |
An AVL system allows automated announcements to be made on board the vehicle according to the vehicle’s location |
| Automatic passenger counting (APC) - described later in this module |
Hardware and Software |
An AVL system is used in conjunction with an APC system to determine when and where passengers are boarding and alighting |
| Real-time arrival/departure information - described later in this module |
Hardware and Software |
The calculation of real-time vehicle arrival or departure information is based on data generated by an AVL system |
CAD allows for a "single point" logon for all on-board systems. With one logon, the driver can initiate the systems that are connected to the CAD (e.g., AVL, farebox). Single point logon reduces the potential for error (e.g., one system logged to a different route than the others). Also, where there is more than one GPS unit on board (e.g., APC systems that have their own GPS unit), single point logon provides one GPS location and time/date stamp for all systems, keeping operational information being used and generated by on-board systems synchronized.
The application of CAD/AVL focuses on determining where vehicles are located, and whether or not dispatch should take any action depending on the vehicle’s adherence to the schedule or route. Figure 6 shows the primary functions of a CAD/AVL system on board a transit vehicle and in the dispatch center.
Figure 6. CAD/AVL Functionality
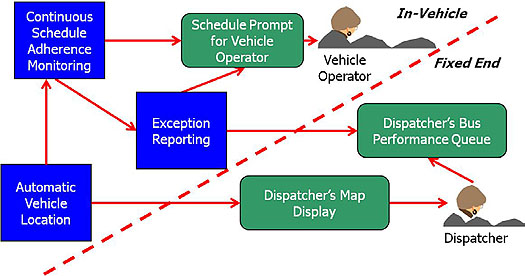
(Extended Text Description: This flow chart demonstrates CAD/AVL functionality. The chart is divided into two main sections by a diagonal dotted red line. The upper left side is labeled as In-Vehicle. At the lower left corner of the In-Vehicle section, a blue box labeled Automatic Vehicle Location has a red arrow pointing up to a blue box in the upper left corner labeled Continuous Schedule Adherence Monitoring. This box has a red arrow pointing to the right to a green box labeled Schedule Prompt for Vehicle Operator. It also has a red arrow pointing down to the right to a blue box labeled Exception Reporting. This box has a red arrow pointing up and to the right to the Schedule Prompt for Vehicle Operator box, which has a small red arrow pointing to an illustration of a person in front of two gray mounds, labeled Vehicle Operator. Exception Reporting also a red arrow to a green box Dispatcher’s Bus Performance Queue, located in the section identified as Fixed End. The Automatic Vehicle Location box has a red arrow pointing to a green box labeled Dispatcher’s Map Display with a red arrow pointing to an icon of a person in front of two gray mounds, labeled Dispatcher. The icon of the Dispatcher has a red arrow to the Dispatcher’s Bus Performance Queue box.)
The use of information generated by a CAD/AVL system throughout a transit agency can result in significant changes to the way various functional areas and staff skills within a transit agency operate as follows:5
- Operations:
- Significant changes to communications between operators, supervisors, and dispatchers
- Substantial improvements in overall situational awareness for dispatchers and supervisors
- Maintenance:
- The need to support new types of equipment, which in the case of dynamic message signs will extend to requiring an extended mobile maintenance capability
- Determining the most effective on-board maintenance data to collect, based on specific triggering conditions, both for on-board storage and real-time transmission
- Customer service: Effective use of real-time and historical data for addressing customer questions and issues, including strategies for communicating with passengers about real-time information (e.g., incidents and next arrival predictions for stops)
- Security: Improved information on the location and situation of vehicles reporting a security incident
- Information technology: Increased scope and scale of existing activities for supporting networks, servers, workstations, applications, databases, systems integration, and software upgrades
- Planning: Making effective use of new comprehensive data sources in scheduling and performance analysis, including passenger counts, running time, dwell time, and schedule adherence
- Revenue: Taking advantage of the potential for an on-board farebox interface.
- Marketing: The need to introduce and promote the new system for the public.
- Training and human resources: System will be a major source of required training on an ongoing basis.
There are many examples of CAD/AVL systems throughout the U.S. Monterey-Salinas Transit (MST) in Monterey, CA, has been using a CAD/AVL system (called AACS) for many years. The ACS assists MST in daily operations by providing various capabilities to manage its fleet and coach operators in real time. The following features of the ACS have been critical in improving operations at MST:
- Real-time Vehicle Tracking: The coach operators and dispatchers receive schedule adherence warnings when the vehicles are running early or late based on a configurable threshold.
- Text Messaging: Both dispatcher and coach operators send data messages to each other as needed. The store and forward features of the ACS provide the capability of sending messages to employees (via their ID numbers) from a dispatch workstation. These messages pop up when the employee receiving a message logs on to a workstation.
- Covert Alarms: The coach operators can send emergency alarm messages to the dispatch center. MST reports that covert alarms typically occur once or twice a month. Sirens go off at the Communications Center when covert alarms are received.
- Automated Visual Announcements (AVA): The AVA system (with support from the ACS) makes visual and audible announcements at major stops and intersections.
- Route Adherence Monitoring: The dispatchers can use the ACS to monitor vehicles that stray from their routes.
- ACS System Control Log: The control log provides a record of daily events and can be searched using a text/keyword search feature.
- Reporting: The ACS provides several standard reports. Along with the standard reports, the ACS system provides several monthly summary reports that are used to provide summary information to the MST Board.
- Archived Data: The ACS provides data for review by the planning staff as needed. The planning department exports and analyzes archived data using external tools (e.g., Microsoft Excel). Archived data is also used for planning studies. For example, the comprehensive operational analysis study done for the Salinas area in 2006 used data from the ACS.
"The ACS provides a playback feature to review vehicle operation at desired time durations in the past... [This] feature has been very helpful to the operations department. The ability to review vehicle activities within a given time period allows operations staff to investigate customer complaints about early or late arrivals and departures of MST vehicles... Further, this feature assists in investigating situations in which MST may have a valid complaint against a coach operator."6
Automatic Passenger Counters (APCs)
Automatic passenger counters (APCs) refer to technologies that are used to count the number of passengers boarding and alighting a transit vehicle. A microprocessor monitors the passenger activity and uses an algorithm to determine when a passenger has entered or exited a vehicle. Data can either be stored for downloading/uploading or be transmitted via radio. Downloading/uploading can be done by one of several methods, including infrared transfer over an agency’s WLAN in or near an agency garage. Some APC systems monitor odometer readings and door switch signals to identify when a bus stop occurs.
There are several types of APC technology; the two most common ones are treadle mats and infrared technology. The latter method uses infrared beams to make the passenger counts. Infrared devices can be mounted either overhead or on the side.
One important feature of APCs is the ability to accurately "stamp" the data with the exact bus stop location and time of day, most commonly done by integrating the APC with the AVL system. Also, another key component is an on-board microprocessor that can store the data for downloading or preprocessing it for immediate transmission to a central location. And real-time information from APC systems can be used for conditional TSP based on the number passengers on board at a given time.
APC systems are often implemented to reduce the cost of manual data collection and National Transit Database reporting requirements. The data can also be used for route scheduling by, for example, identifying the maximum load point, loading profiles, and optimizing locations for short-turn patterns. Transit operators typically deploy APC equipment on 12 to 25 percent of their vehicles and then rotate the vehicles on different routes as needed.
Many transit agencies have successfully deployed APC systems. Recent case studies of these implementations can be found in.7
Scheduling Software
Scheduling transit services involves activities including trip building, blocking, runcutting, and rostering. The scheduling process is different for fixed-route and paratransit services. For fixed-route services, scheduling software provides a "tool that provides the scheduler with greater flexibility, functionality, and control over scheduling their services. It also works to reduce mistakes, improve vehicle and operator efficiencies, reduce staff time on tedious activities, and provide better reporting capabilities."8
Figure 7. Fixed Route Transit Scheduling Data Flow8 (page 3)
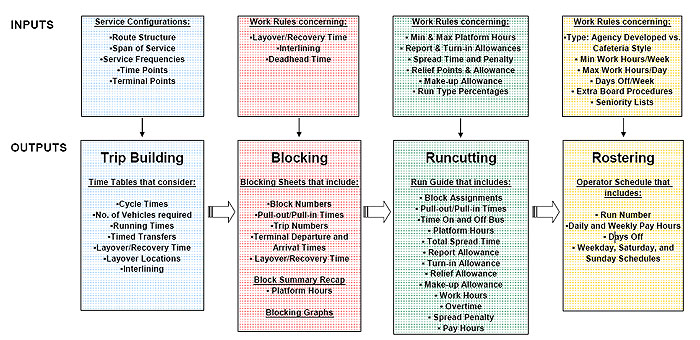
(Extended Text Description: This figure shows the scheduling process for fixed-route transit service. The top row of the diagram represents Inputs, the bottom row represents Outputs. Beginning at the top left, a blue rectangle labeled "Service Configurations" lists the following inputs: Route Structure, Span of Service, Service Frequencies, Time Points, and Terminal Points. An arrow points to an output box labeled "Trip Building" with an output of "Time Tables that consider: Cycle Times, No. of Vehicles required, Running Times, Timed Transfers, Layover Recovery Time, Layover Locations, and Interlining." From the "Trip Building" box, an arrow points to a red box labeled "Blocking." Inputs required for "Blocking" appear in a red box above, and include the following work rules concerning: Layover/Recovery Time, Interlining, and Deadhead Time. The "Blocking" outputs listed in the bottom rectangle are "Blocking Sheets that include: Block Numbers, Pull-out/Pull-in Times, Trip Numbers, Terminal Departure and Arrival Times, and Layover/Recovery Time." Also listed is "Block Summary Recap" with "Platform Hours" listed underneath, and "Blocking Graphs." From the "Blocking" box, an arrow points to a box labeled "Runcutting." The inputs in the box above this area address the need for "Work Rules concerning: Min & Max Platform Hours, Report & Turn in Allowances, Spread Time and Penalty, Relief Points & Allowance, Make-up Allowance, and Run Type Percentages." The output listed in the "Runcutting" box below is a "Run Guide that includes: Block Assignments, Pull-out/Pull-in times, Time On and Off Bus, Platform Hours, Total Spread Time, Report Allowance, Turn-in Allowance, Relief Allowance, Make-up allowance, Work Hours, Overtime, Spread Penalty, and Pay Hours." From the "Runcutting" box an arrow points to a yellow box labeled "Rostering." The inputs for "Rostering" that are noted above include work rules concerning the following: Type - Agency Developed vs. Cafeteria Style, Min Work Hours/week, Max Work Hours/ Day, Days Off/Week, Extra Board Procedures, Seniority Lists. The "Rostering" output noted in the lower box includes an Operator Schedule that addresses: Run number, Daily and Weekly Pay Hours, Days Off, Weekdays, Saturday, and Sunday Schedules.)
In April 2006, Chattanooga Area Regional Transportation Authority (CARTA) completed the deployment of new fixed route scheduling software. Although the new software provided some immediate benefit, the full benefit will not be achieved until the various on-board technologies were installed and integrated with the CAD/AVL system and with the mobile data computers. The fixed-route scheduling software immediately supported more efficient development of the blocks, runs, and rosters for fixed-route schedules and allowed the user to explore various alternative scenarios.9
"MST has recognized several benefits from the scheduling system. HASTUS has allowed MST to perform runcutting in less time than it took using their prior product; currently, it takes 2 to 3 hours to perform the runcutting. In addition, MST can fine-tune blocking by bringing trips together more efficiently in the HASTUS system."10 (page 52)
"In 2005, MST implemented new contract rules which required scheduling software that would take these rules into account. At the same time it needed to replace the existing fixed-route scheduling software, so MST procured new the new HASTUS scheduling software from Giro, Inc. HASTUS is able to handle specific contract requirements such as meal and rest breaks and can perform better runcutting than the previous software."10(page 57)
Paratransit scheduling and dispatch management software supports paratransit booking (reservations), scheduling and manifest generation prior to trip completion, and trip validation, billing, and reporting after trip completion. Integration with a CAD/AVL system and on-board MDTs provides paratransit software with the capability to better support same day scheduling adjustments, implement electronic manifests, and collect, in real-time, data on completed trips.
"Unlike conventional fixed-route service, paratransit vehicles make sequences of door-to-door trips determined by their riders' origins, destinations, and requested trip times. Where fixed-route service strives to adhere to a set schedule of arrival times along a predetermined route, paratransit service must meet standards for maximum ride times and maximum time 'windows' for estimated arrival at origins and destinations that change daily. Automated scheduling software enables the reservation or dispatch operator to build and revise a vehicle’s daily trip sequence, or 'manifest,' according to the paratransit system’s capacity and available trip times. Automated scheduling can be used for pre-arranged trips and, in some cases, for real-time trip scheduling. The paratransit software [often] allows both advance reservation and same-day trip scheduling. The system’s functions [can] include client registration and Americans with Disability (ADA) eligibility determination; trip reservations and dispatching; schedule adjustment assistance in response to cancellations and other same-day schedule changes; and tracking of customer complaints and comments."11
Transfer Connection Protection (TCP)
TCP uses two other technologies mentioned earlier. An MDT operates in conjunction with a CAD/AVL system to provide TCP. TCP is triggered when the vehicle operator of an incoming vehicle makes a transfer request. The incoming vehicle’s operator is able to use the MDT to enter the outgoing route, by selecting from a predefined list. The central system will determine whether the outgoing vehicle can and should be held without any need for dispatcher intervention based on the estimated arrival time of the incoming vehicle. The central system will notify the incoming vehicle’s operator via the MDT whether the outgoing vehicle will be held. The central system will also notify the outgoing vehicle’s operator via the MDT if it is to hold, until what time and for what route. The dispatcher is able to review current pending transfers, including the incoming and outgoing vehicles involved, and the time the incoming vehicle is expected to arrive at the transfer.
In 2003 and 2004, the USDOT ITS program partnered with the Utah Transit Authority (UTA) and successfully launched a connection protection service in Salt Lake City for transfers from the higher frequency light rail TRAX trains to the lower frequency bus services.12
This TCP system includes the use of MDTs, GPS-based AVL, and specialized software to determine if connecting buses need to wait for trains that are running late. The UTA TCP system’s functionality13 is as follows:
- MDTs are mounted on both trains and buses. The MDT on trains contains a GPS receiver that provides location information via a 900-MHz radio.
- When a train is going to arrive late, this information is relayed to the TCP system, which automatically calculates which buses will be impacted.
- Immediately, the connection protection system determines when to hold a bus and how long a specific bus can wait for a train without serious impact to the schedule.
- An automated message is sent to the bus driver instructing him to wait until a specific time for the arriving train.
UTA fully deployed this system.14 "The evaluation of the program15 revealed that the TCP service has been well regarded by the stakeholders, especially travelers. The evaluation revealed that almost 86% riders (out of a total of 522 survey respondents) were satisfied with their connection experiences. The overall feedback from the TRAX-to-bus TCP implementation was positive. The evaluation concluded that TCP can be a useful tool to meet the needs of customers. However, operators' judgments regarding wait times as per the 'hold until' TCP message at transfer points (e.g., based on bus schedules, current schedule adherence status and expected arrival of the 'incoming'*** vehicle) are 'key ingredients' to successful TCP implementations."12
*** ‘Incoming’ vehicle in the context of TCP refers to the vehicle from which a TCP is requested.
TCP is one of the three applications in the Integrated Dynamic Transit Operations (IDTO) bundle within the USDOT Connected Vehicle Program. T-CONNECT is defined as follows: "T-CONNECT is a concept that is intended to improve the probability of automatic intermodal transfer connections for travelers who utilize more than one mode for their trips. Travelers will have the ability to request a transfer using their personal devices or on-board transit vehicles (with assistance from drivers or using agency-equipped on-board interactive devices). Based on the system configuration (system schedule, schedule adherence status and delay thresholds, and service variability), connection protection rules and traveler requests, the system will automatically determine the feasibility of a requested transfer. When a transfer request can be met, the system will automatically notify the traveler and the driver of the vehicle to which the traveler intended to transfer.
While making decision on a transfer request, the T-CONNECT system is expected to take into account the overall state of the transportation system, including connection protection requests made by other travelers as well as real-time and historical travel conditions for the services affected, and pre-determined connection protection rules agreed upon by the participating agencies and transit modes, as indicated earlier. The system will also continue to monitor the situation and provide connection protection status updates to travelers as appropriate on their personal devices. In addition, travelers onboard affected (e.g., delayed) transit vehicles (such as buses waiting at a commuter rail station for a delayed train) may also receive information through onboard devices, such as dynamic message signs (DMS), indicating the vehicle is waiting for other travelers."16
Transit Signal Priority (TSP)
TSP systems give authorized transit vehicles the ability to automatically change the timing of traffic signals. This is often limited to extending the green cycle, but can result in red cycle truncation and phase insertion. Further, it may only be done "conditionally" based on passenger load, type of service (BRT vs. local), and schedule adherence. The goal of these systems is to give priority to transit, and priority or preemption to emergency vehicles by reducing wait time at traffic signals without having an adverse impact on traffic. (Sometimes, preempting signals for emergency vehicles can have an adverse effect on traffic.)
"TSP systems may involve the interaction of four major elements, the transit vehicle, transit fleet management, traffic control, and traffic control management. These four sub-systems are then enhanced with four functional applications of vehicle detection, priority request generation (PRG), priority request server (PRS), and TSP control. Or more specifically:
- Detection - A system to deliver vehicle data (location, arrival time, approach, etc.) to a device that is routed to a Priority Request Generator;
- Priority Request Generator/Server - A system to request priority from the traffic control system and triage multiple requests as necessary;
- Priority Control Strategies - A traffic control system software enhancement (ideally more versatile than pre-emption) that provides a range [of] 'TSP Control Strategies' that address the functional requirements of the traffic jurisdiction;
- TSP System Management - Incorporates both traffic and transit TSP functions in both the transit management and traffic control management that can configure settings, log events, and provide reporting capabilities."17
Communication between the bus and the signal controller can be via radio frequency (as in DSRC), infrared, sonic, Wi-Fi mesh network, or cellular network. With transit applications, some traffic signal controllers are able use information communicated from the vehicles concerning their on-time status, indicating that the only vehicles that are running a prescribed amount of time behind schedule would be granted priority. This serves to limit the disruption to normal signal timing patterns and progression sequences with other coordinated signals on a roadway. This type of TSP is shown in Figure 8. In the case when TSP borrows seconds from a signal phase for another phase, resulting in the red phase being shortened or the green phase being extended, many TSP systems keep the overall cycle synchronized.
Figure 8. TSP Example
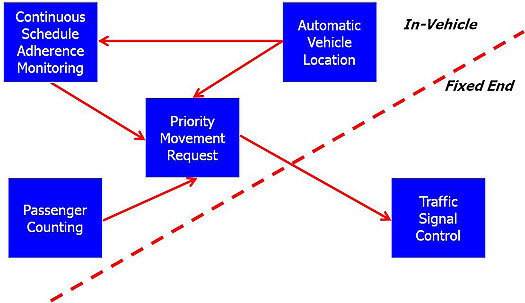
(Extended Text Description: This is a text graphic of a TSP example. The graphic is divided into two sections via a diagonal red dotted line. The left side is labeled In-Vehicle and there are four text boxes on that side. Both Continuous Schedule Adherence Monitoring and Passenger Counting point to Priority Movement Request. Automatic Vehicle Location points to Continuous Schedule Adherence Monitoring and Priority Movement Request, which also points to Traffic Signal Control, which is on the right side of the graphic, and is labeled Fixed End.)
In Los Angeles, the MetroRapid BRT service uses signal priority. A request for signal priority is made to a central signal control center, rather than directly to a signal. If the request is granted, the central signal control center sends a message to the appropriate signal(s) to extend the green phase.
Another way to accomplish centralized signal priority is through the use of AVL. When the bus is running late, the on-board MDT unit sends a message to the Transit Central Management System (TCMS) requesting priority. The TCMS, in turn, requests priority treatment from the Traffic Control System (TCS). It provides the TCS with the location of the intersection that is of interest. The location of the intersection could be in terms of longitude/latitude, or it could be an alphanumeric ID depending on the TCS. The TCS would then determine if it should grant priority treatment based on certain criteria. If priority is to be granted, the TCS will trigger that signal to provide an extended green light for the approaching bus.
In some cases, depending on the logic available in the control box at the intersection, the decision-making process—whether or not to grant priority—could take place right at the intersection. In this case, the TCS simply conveys the TCMS request for priority treatment.
Another approach to TSP is Passive TSP. In these systems, the traffic signals are set to turn green based on an average public transit vehicle speed. In other words, there is no interaction between the public transit vehicle and traffic signal system. The signal timing is programmed to be more optimal for public transit speeds than private vehicle speeds.
TSP systems can include are queue jumps and bypass lanes18 and relevant concepts such as bus specific signals.
The major advantage of a centralized system is that it eliminates the need for hardware on board vehicles as well as at intersections. Hence, signal priority will be available at any intersection under the control of the TCS. However, because some adjoining cities or suburbs may have their own TCS systems, signal priority will not be available under those jurisdictions unless their TCSs are interfaced with the same TCMS.
Overall, TSP helps keep the bus on schedule, especially at stops toward the end of a run, resulting in service reliability. Many customers expect this reliability and predictability if they rely on transit to meet their travel needs. The more passengers that are picked up by a transit vehicle along a route, the more potential there is for the vehicle to fall behind schedule and need TSP. Thus, the more productive the route is, the more there is a need for TSP. The less productive the route is, the more likely the vehicles will remain on schedule.
There are several transit agencies that have successfully implemented TSP systems.
In New York City, the New York City Department of Transportation (NYCDOT) and Metropolitan Transportation Authority (MTA) are embarking on an ambitious program to provide TSP to 6,000 buses in New York City. A key component of the project is New York City’s dedicated broadband wireless infrastructure (NYCWiN), which was created by the city’s Department of Information Technology and Telecommunications (DoITT) to support public safety and essential urban operations. Because NYCWiN supports the implementation of TSP without any additional hardware or infrastructure changes, this approach is particularly cost-effective and attractive for widespread implementation of TSP in New York. The City’s Traffic Management Center in Queens, New York can use NYCWiN to process real-time messages from buses indicating their position and route, and then transmit wireless TSP instructions to local traffic signal controllers. These controllers can then expedite bus movements in one of three ways: by extending a current green signal; by cutting short a current red signal and returning early to green; or by queue jumping, that is, providing an advanced green signal at a specially configured near-side bus stop allowing only buses to jump the queue.19
Yard Management
Yard management provides a tool to manage fixed-route vehicles when they are located in the yard. Typically, the location of vehicles is visually displayed on a digitized map of the yard layout. The system normally automatically locates fixed-route vehicles within a certain distance accurately inside the yard. Also, the system allows yard attendants to adjust vehicle locations manually on a yard map, if necessary. The technology used for locating vehicles within the yard can be done by a variety of methods (e.g., triangulation using wireless routers). This system often provides an interface with a CAD/AVL system to record pull-in and pull-out time, and assigned vehicle operators. Also, the system can be interfaced with fixed-route scheduling software to access vehicle operator information in real time.
There is also a safety and security aspect to yard management tools. The system can alert a transit system to a vehicle that did not return to its designated location (e.g., garage, parking lot) at the end of the service day or that is not at the location but should be. Further, the system can identify a bus that should not be at a particular location but is there, which could be the situation when a driver never pulled out to begin service.
Metro Transit in Minneapolis, MN, uses a yard management system "to help achieve operational efficiency for dispatching Metro Transit’s fleet of 900 buses. The system is installed across 5 garages, covering 915,000 sq. ft. The sensor network provides location information, sufficiently accurate to locate buses in their correct lanes at all times, reducing operating costs by making dispatch and maintenance operations more efficient. Each bus has a real-time location, ultra wideband radio system transmitter, positioned on its rooftop. [This] tag transmits a signal to a network of sensors located in the garage, which calculate the bus location several times per minute. In addition to location, the system is able to provide a wide range of information to garage dispatchers, including bus type, and maintenance status. This information is displayed in a web browser and enables the dispatchers to schedule buses, ultimately determining bus departure and arrival times and minimizing time spent in maintenance."20
Intelligent Vehicle Technologies (IVTs)
Several IVTs reduce the probability of vehicle accidents through the use of vehicle controls and driver warnings. These systems help drivers process information, make better decisions, and operate their vehicles more effectively. One of these areas is collision avoidance systems (CAS). CAS technologies range from providing a warning to taking control of the vehicle. In terms of safety, fewer accidents translate to big savings in legal fees and lawsuits. In terms of operations, fewer collisions mean that a larger portion of the fleet is in running condition. Further, with a greater portion of the fleet in running condition, the transit agency can lower its spare ratio making it possible to put more buses on existing or new routes.
CAS include the following:
- Rear Impact Collision Warning System: this system provides visual warnings on the rear of a bus to warn following drivers of a potential collision.
- Side Collision Warning/Object Detection System: This is also called Lane Change and Merge Collision Avoidance. It provides support for detecting and warning the vehicle operator of vehicles and objects in adjacent lanes (e.g., blind spots). And if a driver in adjacent lanes to the bus tries to execute an unsafe merge, the system provides a visual and/or audio warning to that driver.
- Frontal Collision Warning System: this system senses the presence and speed of vehicles in the bus lane, and provides warnings and limited control of the bus speed, to minimize the risk of collisions. Frontal collision crashes account for nearly 30 percent of all transit vehicle-related crashes and often lead to property damage, service interruptions, injuries, and increased traffic congestion.
- Intersection Conflict Warning System: "Typically comprised of static signing, detection and dynamic elements, these systems are used to provide substantial warnings to drivers at intersections where poor site distance or gap acceptance have contributed to high crash rates. Also referred to as Collision Countermeasure System, Cooperative Intersection Collision Avoidance System, Crash Avoidance Systems, Intersection Warning System, and Traffic Actuated Warning Signs."21
- Lane Change/Merge Warning System: "These in-vehicle electronic systems monitor the position of a vehicle within a roadway lane and warn a driver if it is unsafe to change lanes or merge into a line of traffic. These systems are rearward-looking, radar-based systems. They assist drivers who are intentionally changing lanes by detecting vehicles in the driver’s blind spot."22
- Pedestrian Collision Warning: This type of system can "provide warnings to transit vehicles of a pedestrian’s presence in the roadway—either in a crosswalk or outside of the crosswalk. A Pedestrian in Signalized Crosswalk Warning Application is being tested during the USDOT'S Connected Vehicle Safety Pilot. The application allows a bus driver to receive an alert of the presence of a pedestrian near or in a crosswalk as the driver makes a right or left turn at a signalized intersection."22a
Another group of IVTs are called vehicle assist and automation VAA). VAA for transit operations assists or automates the movement of buses to allow precise operations in extremely narrow lanes, at stations and potentially bus maintenance facilities. This category of IVTs includes the following:
- Precision Docking: This system positions the bus relative to the curb or loading platform. The driver can maneuver the bus into the loading area and then turn it over to the docking automation. Sensors continually determine the lateral distance to the curb, front and rear, and the longitudinal distance to the end of the bus loading area. When the bus is properly docked, it will stop, open the doors, and revert to manual control (drivers can override the system at any time). This technology allows for safer boarding and egress for the disabled, elderly, and children. Further, it allows for shorter bays in terminals, which, in turn, mean savings in construction cost. Precision docking technologies include Kassel Kerb, low-friction rub bar, mechanical guide wheel, optical guidance, and magnetic guidance.
- Vehicle Guidance: Controls the lateral movement of the bus while the operator controls the speed of forward motion.
- Vehicle Platooning: Provides vehicle-to-vehicle communications to allow vehicles to follow each other at close distances.
- Automated Operations: A fully automated driving where both longitudinal and lateral control may be safely turned over to the on-board system.
The Federal Transit Administration (FTA) and the ITS Joint Program Office are sponsoring three VAA projects: California-Oregon demonstration, San Diego Bus on Shoulder Service (BOSS), and Minnesota Driver Assist System.
The Greater Cleveland Regional Transit Authority in Cleveland, OH, operates a bus rapid transit (BRT) services called the HealthLine. The HealthLine vehicles use three tools for precision docking, the primary one being the mechanical guide wheel/docking arm. The other two tools are a painted blue guide stripe on the pavement and a docking assist system. The blue guide stripe helps the driver to align the vehicle as he or she approaches the station. The docking assist system (DAS) consists of two ultrasonic sensors, one system controller and an audible warning device. As the driver approaches the station, the DAS will emit four successive beeps when contact with the platform is imminent. The painted guide stripe and DAS are not required for proper operation of the mechanical guide wheel. They were added as an extra assist to the guide wheel.23
Figure 9 shows the docking arm and the blue guide strip.
Figure 9. Precision Docking Example23
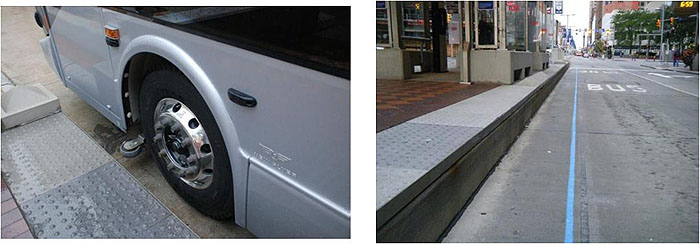
(Extended Text Description: This graphic contains two photographs. The first photograph shows an example of a Vehicle Assist and Automation tool. The picture shows the front left wheel of a bus. To the left of the bus is a gray curb. Attached to the bus just in front of the wheel is a small wheel installed sideways so that the rotating portion of the little wheel extends beyond the normal width of the bus. The second is a photograph looking down a city street at curb level. On the left is a gray curb. To the right of the curb, there is a light blue line running along the bus lane. Additional Author notes: Vehicle Assist and Automation (VAA) for transit operations assists or automates movement of buses to allow precise operations in extremely narrow lanes, at stations, and potentially bus maintenance facilities.)
Lane Control Technologies (LCTs)
LCTs include bus shoulder riding, intermittent bus lane (IBL), and moving bus lane (MBL). IBL/MBL "is a restricted lane for the short time that the bus uses that particular lane. IBL can also be called a moving bus lane. This concept consists of using a general-purpose lane that can be changed to a bus-only lane just for the duration of time needed for the bus to pass. Afterward, the lane reverts back to a general-purpose lane until another approaching bus needs the lane for its movement."
From an operational protocol standpoint, the IBL system is intended to be activated only when the flow of general traffic is operating below a speed that inhibits bus transit speeds. When that threshold is reached—as sensed by technologies that can provide knowledge of real-time traffic conditions—longitudinal flashing lights embedded in the roadway lane divider are activated to warn general-purpose drivers that they cannot enter that lane and that a bus is approaching. Vehicles already in the lane are allowed to continue on. This leaves a moving gap or a moving time window for the bus to travel through. This moving gap can be best described as a zone measured from the back of the bus bumper to a fixed distance ahead of the bus.
When traffic conditions are not expected to cause delays to the bus movement, the intermittent bus lanes should not be activated.
Bus speeds and reliability are improved whenever the bus is able to flow independently from the general traffic, but it can be cost-prohibitive to build exclusive bus lanes for routes that are lower in frequency. IBL does not require expensive capital costs because it uses the existing roadway infrastructure and takes only the time it needs to move separately from general traffic. This allows the bus lane to be used for general traffic the majority of time.
It has low implementation costs and uses well known, widely used and proven traffic signal management technologies and products.
An AVL system is required to establish the bus location. This system ties into variable message signs (VMS) to inform the drivers of lane restriction. This system also requires integration into real-time ITS traffic monitoring systems that record levels of congestion and compute the dynamic space and approach length required to activate on and off the longitudinal embedded flashers. This system is dependent on an interconnect and special software within the signal controller system of the existing roadway.24
Back to top
Traveler Information
Automatic Voice Announcements (AVAs)
An AVA system provides audio and visual announcements to on-board riders and those waiting to board. As each fixed-route vehicle approaches a stop or other designated location, a digitally recorded announcement is automatically made over the on-board public address (PA) system speakers and displayed on dynamic message signs (DMS) inside the vehicle to inform passengers about upcoming stops, major intersections, and landmarks. AVA systems typically have the capability of making time-based, location-based, and vehicle operator-initiated announcements/displays. Further, AVA systems can make an exterior announcement of the current route number and destination when doors open at a stop.
One of the major reasons for the deployment of AVA systems is to comply with the applicable provisions of the Americans with Disabilities Act (ADA) of 1990, as well as providing basic vehicle location awareness and en-route traveler information to riders. In order to ensure that next-stop announcements are made at the appropriate location, AVA systems are interfaced with AVL systems.
Another development is integrating bus destination signs with AVL systems to ensure that destination information display for waiting passengers is accurate. This is particularly important on multi-route corridors or multi-branch routes. This integration takes the responsibility away from the vehicle operator by automating destination sign changes with the AVL/CAD system. Perhaps the most sophisticated examples of in-vehicle information involve transit operators that are enhancing their fleet management systems so that passengers who are already on board can request and get confirmation on transfers to other transit services.
Transit authorities are beginning to implement "bus is turning" external announcements at specific geographical locations to alert pedestrians and reduce collisions. LYNX in Orlando has tested the system on its LYMMO BRT lanes.
Many transit agencies have deployed AVA systems. One of the most recent implementations of AVA is on fixed-route vehicles operated by the Worcester Regional Transit Authority (WRTA) in Worcester, MA. All 46 fixed-route vehicles have been equipped with AVA, which announces and displays the next stop and key intersections. Some of the lessons learned from this deployment include the following:
- The challenge associated with making external announcements was addressed by shortening the length of the announcements—originally, they were too long and were still announcing after the door closed;
- During the design of the system, a feature that had not been considered previously was defined—looping of announcements at terminals (while the doors are open);
- Trip patterns had to be validated, as usual, to ensure that the announcements are accurate and being made at the appropriate times (within a certain distance of the "trigger box"). WRTA used interns to conduct this validation;
- The volume with which the announcements were made on board had to address both driver and passenger concerns; and
- The implementation of Spanish announcements (in addition to English) was cancelled due to the differences associated with translating the announcements into Spanish.
En-route/Wayside Traveler Information
Providing improved transit traveler information has advanced significantly over the past 20 years with the advent of new technologies, such as AVL and advanced communications, and of new dissemination mechanisms and media, such as mobile telephones and smartphones. Today, transit travelers, particularly choice riders, expect to have comprehensive information about multiple modes (including traffic information) available to them quickly, in one place or from one source, on a variety of media and at any point during their trip. Transit agencies are being challenged to meet these travelers' needs, given declining budgets and the continuing need to provide efficient service. Paper schedules, manually operated customer information telephone services, and the need for travelers to make several telephone calls to obtain information no longer satisfy travelers. Furthermore, transit agencies are exploring new ways to maintain existing riders and to attract new riders. Providing static and real-time transit information using new strategies is a priority for many transit agencies around the world. These strategies include the use of en-route/wayside technologies such as the mobile Internet, dynamic message signs (DMS), and wireless mobile devices.
To determine the type of technology that is most appropriate for each part of a traveler’s trip chain, it is important to identify each part of the trip chain and all available technologies that could be used. Trip chain locations can be identified as follows:
- Before the trip begins
- At the origin of the trip
- Between the origin and the first transit stop of the trip
- At a bus stop, station platform, station entrance and common area, or terminal location
- On board a vehicle (inside a tunnel or at the surface)
- At a park-and-ride location
- Between the final stop and destination
For each type of real-time customer information, each data element within that data type and for each portion of the trip chain, the following type of technologies are considered to provide en-route/wayside information:
- DMS
- Internet or mobile Internet
- Interactive voice response (IVR) system
- Short message service (SMS) (aka text message)
- Smartphone application (see a section later in this module)
- Social media (e.g., Facebook)
- Alerts that are pushed to a customer based on registered preferences
- Staffed customer information service available by telephone
Further, for each of these technologies, information regarding the frequency with which the information is updated should be defined as well.
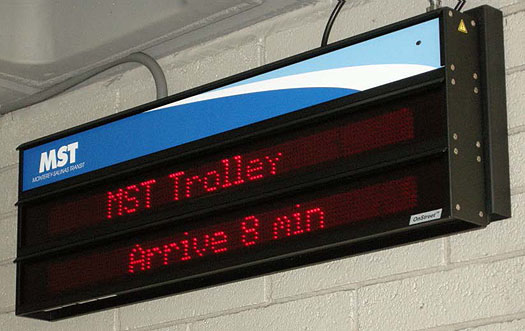
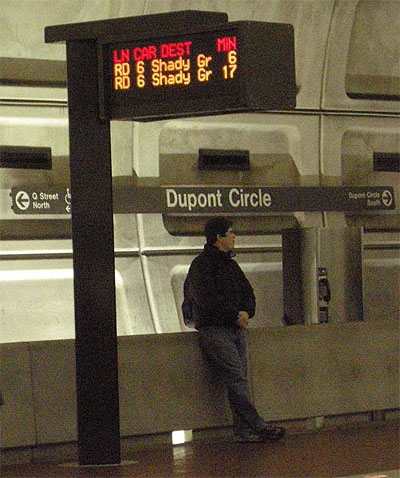
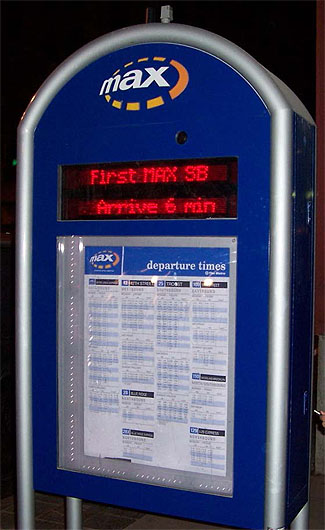
Figure 10 through Figure 13 show different types of DMS that display real-time information. Figure 14 and Figure 15 show mobile Internet pages. Figure 16 shows a sample of using SMS to obtain real-time information.
Figure 10. Monterey Salinas Transit DMS
Source: Carol Schweiger, 2009.
Figure 11. WMATA DMS in Dupont Circle Metrorail Station
Source: Carol Schweiger, 2007.
Figure 12. KCATA MAX (BRT Service) DMS
Source: TranSystems, 2005.
Figure 13. TriMet LCD DMS at Bus Stop Near Lloyd Center
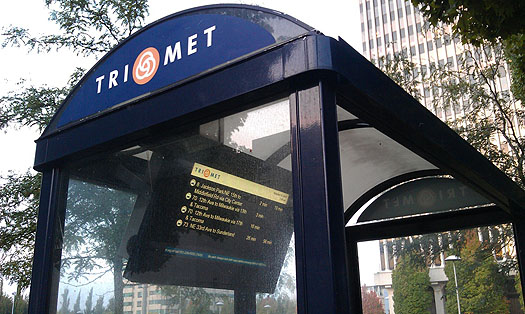
Source: Carol Schweiger, 2011.
Figure 14. Washington Metropolitan Area Transit Authority
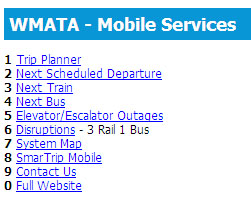
(Extended Text Description: This graphic appears as a menu section from the Washington Metropolitan Area Transit Authority mobile website. The header reads WMATA - Mobile Services, with numbered menu items: 1 Trip Planner, 2 Next Scheduled Departure, 3 Next Train, 4 Next Bus, 5 Elevator/Escalator Outages, 6 Disruptions - 3 Rail 1 Bus, 7 System Map, 8 SmarTrip Mobile, 9 Contact Us, 0 Full Website.)
Source: WMATA Mobile Website.
Figure 15. OneBusAway Mobile Website
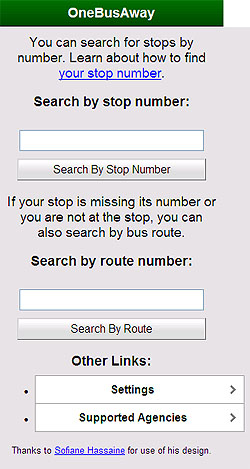
Figure 16. Real-Time Information via SMS for Chicago Transit Authority
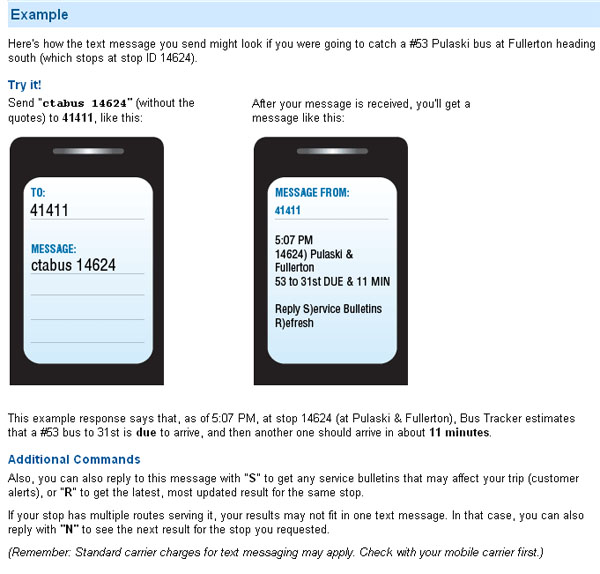
(Extended Text Description: This graphic offers examples of real-time information via SMS for Chicago Transit Authority. The header reads Example with the following text information and graphics: Here’s how the text message you send might look if you were going to catch a #53 Pulaski bus at Fullerton heading south (which stops at stop ID 146624). Try it! Send "ctabuss 14624" (without the quotes) to 41411, like this: (there is then an image of a smart phone with To: 41411 Message: ctabus 14624 on the screen). After your message is received, you'll get a message like this: (there is then another image of a smart phone with Message from 41411 5:07 PM 14624) Pulaski & Fullerton 53 to 31st DUE & 11 MIN Reply S)ervice Bulletins R)efresh). This example response says that, as for 5:07 PM, at stop 14624 (at Pulaski & Fullerton), Bus Tracker estimates that a #63 bus to 31st is due to arrive, and then another one should arrive in about 11 minutes. Additional Comments: Also, you can also reply to this message with "S" to get any service bulletins that may affect your trip (customer alerts), or "R" to get the latest, most updated result for the same stop. If your stop has multiple routes serving it, your results may not fit in one text message. In that case you can also reply with "N" to see the next result for the stop you request. (Remember. Standard carrier charges for text messaging may apply. Check with your mobile carrier first.)
Source: Courtesy Chicago Transit Authority (www.transitchicago.com/howto/bus-tracker-by-text/).
A unique deployment of DMS was accomplished by Mobility Lab (https://mobilitylab.org/) in Arlington, VA, in 2012. These electronic signs display real-time transportation information in two local establishments (a coffee shop and a bar). Mobility Lab,…
“…an initiative of Arlington County Commuter Services, focuses on the professional discipline of Mobility Management, also called Transportation Demand Management or TDM. TDM is about making individuals aware of their transportation options, including: route, time of travel and mode. In the broadest sense, TDM is defined as providing travelers with effective choices to improve travel efficiency and reliability.”25
The Java Shack coffee shop near Courthouse in Arlington, VA, and the Red Palace bar on H Street in Washington, DC, have…
…digital screens showing real-time transit arrivals and Capital Bikeshare availability. At Java Shack, customers can see the next [Washington Metropolitan Area Transit Authority (WMATA)] Metrobus, [Arlington Transit] ART, or [WMATA] Orange Line arrivals, and bike availability at the Capital Bikeshare [CaBi] station across the street. The Red Palace screen faces outward onto the sidewalk on H Street, letting passersby see their bus and CaBi options.26
Mobility Lab developed these screens, which display local rail, bus, and bikeshare information. The overall goal for developing these screens was to help the individual make a trip from point A to point B in the Washington, DC, area by providing real-time information presented in a readable manner. These are the first two screens deployed by the Mobility Lab; the screens became operational in early 2012. The screens are shown in Figure 17 and Figure 18. These screens are now sold by TransitScreen, a transportation software and digital signage company, which was founded in 2012.
Figure 17. Multi-Agency Display Located at Java Shack
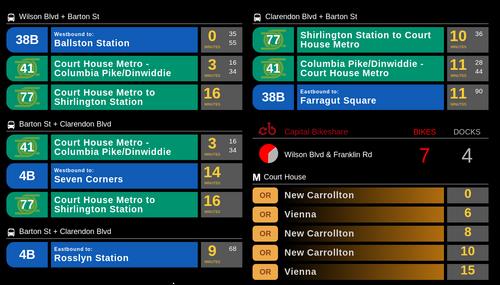
(Extended Text Description: This graphic demonstrates a multi-agency display located at Java Shack. This display has two columns with rows of real-time transit information, including routes, times, stops, and other local rail, bus, and bikeshare information. Each row in each column has three sections: the first (left to right) shows rail/bus numbers, the center sections shows location/destination/stop/route information, and the third shows schedule/time information.)
Source: https://mobilitylab.org/2012/01/05/experimental-real-time-transit-screens-come-to-arlington-and-dc/.
Figure 18. Mobility Lab Screen Located at Red Palace Bar
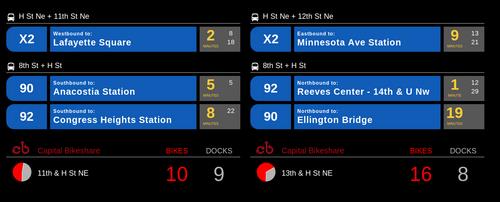
(Extended Text Description: This graphic demonstrates a mobility lab screen located at Red Palace Bar. The screen has two columns with rows in each column, showing rail, bus, and bikeshare information including routes, stops, and times. Each row has three sections. The first (left to right) has the rail or bus number, the center has destination/stop/route information and the last has schedule/time information.)
Source: https://mobilitylab.org/2012/01/05/experimental-real-time-transit-screens-come-to-arlington-and-dc/.
Another type of dissemination media for en-route traveler information is an interactive screen, which has the capability to greatly expand the volume and depth of the information being provided (primarily due to the large amount of real estate on the screen). New York Metropolitan Transportation Authority (MTA) New York City Transit (NYCT) has deployed several large interactive displays in a pilot program and, as of April 2015, the On The Go Travel Station network has 140 digital, interactive screens located in 29 stations in the Bronx, Brooklyn, Manhattan and Queens.27 On the Go! Travel Stations have 47-inch touch screens that provide subway alerts/notifications, trip planning, subway map, service status, elevator status, information about key destinations, and planned construction, with advertising at the very bottom of the screen. See Figure 19 for a photo of the On the Go! Travel Stations.
Figure 19. MTA On the Go! Travel Station28
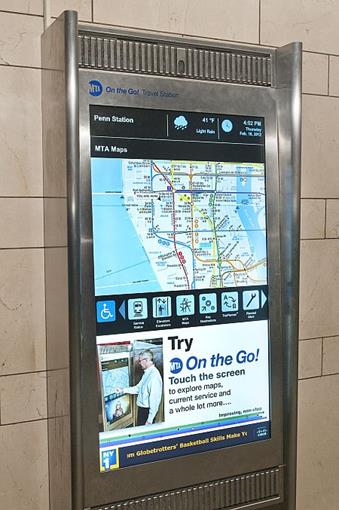
(Extended Text Description: This is a photograph of an MTA On the Go! Travel Station in New York City. The station is wall-mounted and features a large touch screen (poster-sized). The screen has information such as station location (in this case, Penn Station for example), as well as weather and time, at the top. Below this is a section for MTA maps, and a large map of a portion of the New York City Transit system appears. Below this section are a series of icons including handicapped information, service, elevator/escalator, maps, payment, trip planning, and planned work information. Below this is an advertisement/instructions for the On the Go! system.)
Source: Image Copyright Metropolitan Transportation Authority/P. Cashin.
Another application of en-route/wayside traveler information is infotainment. Infotainment uses ITS systems, such as on-board visual displays and AVL, to provide both information and entertainment. It is also a venue for expanding ITS deployments by using third-party content (advertising) to supplement the funding available to deploy and maintain the systems. However, in TCRP Synthesis 104: Use of Electronic Passenger Information Signage in Transit,29 only one out of 37 transit agencies that responded to a survey indicated that they include advertising on the same electronic signage that provides passenger information. There were a variety of reasons why agencies did not include advertising.
Yet another dissemination media is social media. According to Susan Bregman:
“Social media provide transit agencies with an unparalleled opportunity to connect with their customers. These connections may take many forms, but they all can help agencies personalize what can otherwise appear like a faceless bureaucracy.”
“Social media,” also called social networking or Web 2.0, refers to a group of web-based applications that encourage users to interact with one another. Examples include blogs, social and professional networking sites such as Facebook and LinkedIn, micro-blogging site Twitter, media-sharing sites such as YouTube and Flickr, and location-based sites such as Foursquare. Transit agencies have begun to adopt these networking tools, and their reasons for doing so typically fall into five broad categories.
- Timely updates - Social media enable agencies to share real-time service information and advisories with their riders.
- Public information - Many transit organizations use social media to provide the public with information about services, fares, and long-range planning projects.
- Citizen engagement - Transportation organizations are taking advantage of the interactive aspects of social media to connect with their customers in an informal way.
- Employee recognition - Social networking can be an effective tool for recognizing current workers and recruiting new employees.
- Entertainment - Lastly, social media can be fun. Agencies often use social media to display a personal touch and to entertain their riders through songs, videos, and contests. (Susan Bregman, “Uses of Social Media in Public Transportation,” TCRP Synthesis 99, Transportation Research Board, Washington, DC, 2012, page 1).
Finally, a few transportation agencies are beginning to provide information regarding parking availability in or around transit stations. For example, the San Francisco Municipal Transportation Agency (SFMTA) provides a smartphone application, SFpark that “allows you to find a parking space in San Francisco when you need one, with real-time parking availability and rates. It is currently available in the Financial District, along the Embarcadero, Fisherman’s Wharf, Civic Center, Marina Union Street shops, and the Mission District.” (www.sfmta.com/demand-responsive-parking-pricing) Further, at the Washington Metropolitan Area Transit Authority (WMATA), “Metro riders can now check real-time metered parking availability at the Fort Totten Metrorail station on Metro’s website and with their mobile devices as part of Metro’s ongoing efforts to use technology to enhance the customer experience.” (content is no longer available)
On-board Internet Access
On-board Internet access is being provided by some transit agencies, particularly on vehicles that service lengthy routes. Some agencies have leveraged on-board communications hardware that provides both data communication for the agency and Wi-Fi for passengers.
The CARTA EVDO [Evolution-Data Optimized] network, deployed in 2007, was needed to support data communications between CARTA vehicles and CARTA headquarters. While designing this network, CARTA noted that it could purchase EVDO modems for vehicles with a built-in router and Wi-Fi. This allowed the agency to provide wireless Internet service to passengers at essentially no cost over the cost of the required data communications network. And, the benefit to passengers—free Internet service—was easily observable.30
511, 311, and 211 Systems
On July 21, 2000, the Federal Communications Commission assigned 511 as the nationwide telephone number for traveler information. 511 is being deployed around the country by State and local agencies to provide Statewide and/or regional traveler information. While the primary focus of 511 deployment has been on providing traffic conditions, transit information has been provided by many of the current and planned 511 deployments.
A Transit Cooperative Research Program (TCRP) study revealed that
(1) few 511 systems include even basic transit content and features recommended by the national 511 Deployment Coalition; (2) few transit agencies or 511 system administrators cite any significant adverse impacts associated with their 511 telephone system participation; and (3) in most regions, even modest benefits of transit participation in 511 phone systems justify participation. Significant benefits are most likely realizable primarily in certain environments—those with multiple transit providers and significant numbers of travelers who make day-to-day mode choice decisions based on a combination of traffic and transit information. Significant benefits can also include relief to transit call centers by providing a one-stop shop for comprehensive traffic and transit information.31
Island Explorer, which is operated under contract by Downeast Transportation for the Maine Department of Transportation, provides seasonal (June to October) fixed-route bus service on eight bus routes serving towns on Maine’s Mount Desert Island, including Bar Harbor and Acadia National Park. The Island Explorer service began in 1999 and is supported by a number of public and private organizations. The Statewide Maine 511 system is operated by the Maine DOT and became operational in May 2003. Information on Island Explorer is available on 511 via the 'Acadia National Park' main menu item, under the Island Explorer submenu. During the operating season, automated real-time vehicle departure times are available. During the off-season, a recording is provided identifying the operating season and the fact that during the operating season, arrival time information is available.32
The FCC designated 211 to be used for the locally/regionally operated “community information and referral services” phone systems. The FCC designated 311 to be used for locally/regionally operated, staffed (live operator) phone systems for “non-emergency policy and other government services information.”33
Questions regarding San Francisco Municipal Railway (Muni) go through the city of San Francisco’s citywide 311 telephone information system. The San Francisco 311 center began operations in February 2007 and, at that time, assumed all customer service call center functions for Muni, as it did for many municipal agencies. The 311 center is staffed and operational 7 days per week, 24 hours per day, 365 days per year. Language translation is offered for dozens of languages. San Francisco 311 operators use the following three main information sources for addressing Muni-related customer requests:
- Muni "scheduler" software;
- The NextMuni System (for real-time vehicle arrival time estimates); and
- The regional Trip Planner System, the same one that is available on the regional 511 website (www.511.org).
"Muni views the 311 center as representing a major improvement over their prior Muni-operated call center in terms of the greatly extended hours of operation and overall level of sophistication, including the use of tracking numbers for each call. Muni also noted that use of the Trip Planner by the 311 staff has focused a great deal of attention on the tool, helping to surface and correct problems and, in general, accelerating the refinement of the tool and increasing its value to the region."34
Third-party Transit Information and Trip Planning
Several third parties provide transit information, including Google Transit, Apple Maps, MapQuest, and HopStop. Google Transit is a web-based application that imports agency data in specific file formats (General Transit Feed Specification [GTFS] or GTFS-real-time) to provide a portal for transit trip planning by the general public using Google Maps.
The key features of Google Transit are as follows:
- Regional trip planning tools can be developed by coordinating with different agencies in a region that use scheduling software from various vendors;
- Origin and destination locations can be selected on a map-based interface;
- Google Maps features (e.g., street view, hybrid view, satellite view) are available and can be helpful to riders;
- Google point-of-interest (POI) search around a stop location is available;
- Walk directions are available with turn-by-turn guidance; and
- Riders can use Google Transit and Google Directions on the same portal to get information on trips that require both options (e.g., park and ride trips). As of now, both applications are not directly linked though.
New York City Transit’s participation in Google Transit can be seen at http://maps.google.com/help/maps/mapcontent/transit/index.html. (Content no longer available.)
GTFS-real time is a de facto standard introduced in June 2011 that is being used is to provide real-time information to various applications. "GTFS-realtime is a feed specification that allows public transportation agencies to provide real time updates about their fleet to application developers. It is an extension to GTFS (General Transit Feed Specification), an open data format for public transportation schedules and associated geographic information. GTFS-realtime was designed around ease of implementation, good GTFS interoperability and a focus on passenger information." (https://developers.google.com/transit/gtfs-realtime/)
An example of Google Live Transit Updates, which is based on the use of GTFS-real time, can be seen on https://developers.google.com/transit/google-transit/.
Over 18,000 cities throughout the world are covered on Google Transit as of March 2016.
MapQuest introduced transit and walking directions in 2011. "HopStop (www.hopstop.com), a pedestrian navigation service, provides door-to-door walking, biking, transit, taxi and hourly car rental directions to city residents and tourists alike. The company has built the first national network to facilitate and encourage intra-city as well as city-to-city travel by aggregating hundreds of mass transit systems into one streamlined navigational user experience. HopStop includes HopStop Live! TM, the only real-time social transit app used by millions of people that helps riders get to where they need to go and report delays along the way." (www.hopstop.com/?action=press_release&content_body=24)
In terms of trip planning, there are many systems that provide trip itinerary planning, like Google Transit. One multimodal trip planner is goroo® (https://www.rtachicago.org/), which "was developed by the Regional Transportation Authority (RTA) and utilizes the services of the Chicago Transit Authority (CTA), Metra, and Pace. goroo is a powerful online map and trip planner tool that provides its users with directions using a combination of bus or train routes, driving, biking, and walking directions. With the goroo trip planner you can also view travel itineraries, public transit schedules, maps, alternative routes, area attractions, travel alerts as well as suggested ways to reduce the carbon footprint of your trip." (https://www.rtachicago.org/)
Third-party Smartphone Applications
Starting in the early 2000s, many transit agencies in the United States began to offer static information on mobile devices, including timetables, service alerts, and trip planning. At that time, there were a limited number of mobile devices on the market, meaning that some agencies could develop simple applications for these devices in-house without significant expenditures. For example, in the late 1990s and early 2000s, Bay Area Rapid Transit (BART) in the San Francisco Bay area developed its own applications for the Palm operating system (OS). However, since that time, there has been an explosion of mobile devices on the market, making it virtually impossible for agencies to keep current on the types of devices and their specific requirements, and be able to develop, manage, and maintain mobile applications for these devices. This coupled with the fact that agencies can now provide more types of customer information, caused agencies to look outside their organizations for third parties to assist them in providing information on mobile devices.
In a TCRP Synthesis study published in 2011, it was determined that:
“using a third-party to develop real-time applications and provide real-time information on mobile devices is overwhelmingly the approach that transit agencies are taking for a variety of reasons. There are five key elements of this study finding:
- Many agencies have limited IT and other related staff, making it very challenging to develop applications and manage the information dissemination in-house.
- The myriad of mobile devices and operating systems, and the speed with which new devices are being released, create a demanding environment within which to develop applications and keep up with new technology.
- With mobile content being used in other industries, such as entertainment (e.g., television, radio, movies, music), advertising and consumer products, there is a significant body of knowledge available to facilitate the development of useful and innovative mobile applications.
- With the large number of mobile phone and smartphone subscribers, there is a great deal of familiarity with mobile applications that are similar to real-time transit information.
- The open data movement [discussed later in this module] is having a significant effect on agencies providing real-time information on mobile devices.
Thus, the use of third parties that either specialize in providing mobile content or have the capability to develop transit-specific mobile applications has been widely accepted as an effective approach in the US to providing real-time information on mobile devices. Agencies in the US, for the most part, are not developing their own applications. They are relying on third parties that specialize in developing, disseminating and managing mobile content.”35
Many third-party smartphone applications have been developed for transit agencies around the United States. Individual transit agency websites often provide a list of available smartphone apps, as well as other websites such as City-Go-Round Apps (see www.citygoround.org/apps/). Several examples available on transit agency websites are as follows:
Return to top ↑
Safety and Security
Mobile (On Board and Exterior) and Fixed Video Surveillance
One of the two most common safety and security systems among transit agencies are on-board (interior) and exterior cameras (aka on-board video surveillance). Cameras are gaining popularity as they are a form of crime deterrence. They are also used to review incidents that may have taken place on board a vehicle in the past. In addition, cameras are also playing a role in traffic enforcement on board buses. Cameras are routinely now being used to review driver’s traffic violations such as running a red light and not stopping at a stop sign, as well as to review the last few seconds preceding a collision to determine fault.
On-board and exterior video surveillance can be used for the following purposes:
- Review recorded images
- Potential crime prevention
- Identify criminal activity and perpetrator(s)
- Identify improper driver behavior
- Incident/insurance investigation
Some digital video systems allow authorized users to access the systems via Wi-Fi. This allows these users, such as police or transit supervisors, within a certain range of the transit vehicle, to view what is occurring inside the bus by accessing images from video cameras during an incident.
MST has very successful on-board and facility surveillance systems. MST got the first buses with the camera systems installed in 2002 directly from Gillig. They added cameras to their earlier fleet after that date. Newer buses have been installed, including wiring, by an MST ITS Technician and Maintenance Revenue Mechanic. The initial configuration was six cameras per vehicle, then, newer vehicles had eight cameras. Since then, they have amended the configuration to 7 per vehicle—from the 17′ to 45′ length.
Included were 2.9 mm internal cameras and 4.0 mm external cameras. The forward facing camera is 6.0 mm and the other components are a digital video recorder (DVR) (hard drive for local storage), microphone, in-service lights, and a tag alarm button to enhance the frame rate as well as locking that portion of the DVR until the video has been reviewed.
Additionally, as a safety feature, MST placed a left-hand turn camera on their commuter buses. This setup has a video screen connected to a camera that shows the left-hand view when the left indicator is activated. The external rear-view mirrors on the MST coaches are very large and cause a blind spot. However, the left-hand turn camera is independent of the closed-circuit television (CCTV) system. It uses an infrared camera so the time of day has no effect on the ability to "see" the blind spot.
Figure 20 and Figure 21 are photos of camera equipment on MST buses.
Figure 20. External Camera on MST Bus
Source: Monterey-Salinas Transit ITS Augmentation Project Phase III Evaluation Report (https://rosap.ntl.bts.gov/view/dot/34563).
Figure 21. Camera Facing Out of the Front Window of MST Bus
Source: Monterey-Salinas Transit ITS Augmentation Project Phase III Evaluation Report (https://rosap.ntl.bts.gov/view/dot/34563).
Covert Emergency Alarm and Covert Live Audio Monitoring
Covert microphones and other security technologies are also being heavily deployed along with new AVL/CAD systems. The purpose of a covert microphone is to allow the dispatchers to listen in on what is going on inside the vehicle while an incident is taking place. Covert microphones are one-way communications in order not to alert the person responsible for the incident that the dispatcher/police are listening in. In some systems, when a driver in distress presses a covert switch that activates the covert microphone, the monitor in the dispatcher’s office automatically displays the information for that vehicle and the map display zooms in on the vehicle. All other screens on the dispatcher’s computer will not be accessible until the driver cancels the alarm.
As stated in TCRP Synthesis 93, Practices to Protect Bus Operators from Passenger Assault,36 there are many implementations of covert alarms in transit. For example, the following agencies have deployed covert alarm systems:
- Greater Cleveland Regional Transportation Authority, Cleveland, OH
- Metro Transit, Madison, WI
- Pinellas Suncoast Transit Authority, St. Petersburg, FL
- VIA Metropolitan Transit, San Antonio, TX
On-board Digital Video Recorders (DVRs)
DVRs are connected to on-board cameras to record images from the cameras. DVRs are equipped with a recording drive. Typically, the recording drive is removable to allow the playback of recorded video on a centrally located playback system. Also, the DVR has several configurable parameters, including frame resolution and frame recording rate. Further, the DVR should be able to store a specific number of days of video, beyond which, previously recorded video will be overwritten.
The DVR may have the capability to use Wi-Fi to upload video once the vehicle enters the yard or garage. This allows authorized transit personnel to request video from a specific transit vehicle to review incidents, customer concerns, or for investigations.
As stated in TCRP Synthesis 93, Practices to Protect Bus Operators from Passenger Assault, many transit agencies use DVRs in conjunction with their on-board surveillance systems. Among others, the following agencies utilize DVRs:
- Miami-Dade Transit, Miami, FL
- Metro Transit, Madison, WI
G-force Monitoring
G-force monitoring is implemented for two purposes: to provide a collision alert system and monitor driving behavior. A collision alert system includes a g-force sensor and an electronic data logger to capture and provide information about the unusual movement of transit vehicles and to capture events such as vehicle turns, hard braking, and fast acceleration or deceleration.
The system can warn a vehicle operator about unexpected movements and provide collision warnings to the operator using g-force sensor data. In the event of an accident, a g-force system can store data permanently. This data can be uploaded to a central system.
Typically, a g-force system includes an "event tag" button that allows the driver to manually tag accidents, incidents, and vehicle fault conditions. The system often interfaces with an on-board CAD/AVL system to obtain date and time, latitude/longitude, operator ID, vehicle ID, and route ID information to tag g-force sensor information. Further, the data logger can use this interface to log g-force sensor data when the covert alarm is on. Finally, the system can interface with an on-board video surveillance system to log g-force sensor data when the DVR event flag is on.
In Evaluation of Electronic Data Recorders for Incident Investigation, Driver Performance, and Vehicle Maintenance, several electronic data recorders that include g-force sensors are described, along with the following lessons learned. G-force data can do the following:
- Assist in accident reconstruction and analysis
- Protect transit agencies from litigation
- Reduce cost of insurance
- Analyze operator actions
- Identify maintenance issues
Return to top ↑
Automated Fare Payment
Figure 22. New York MTA Magnetic Stripe Farecard
Source: Copyright Metropolitan Transportation Authority.
Figure 23. MBTA Contactless Smartcard
Source: MBTA.
Figure 24. WMATA Contactless Smartcard
Source: WMATA.
Automated Fare Media
There are currently three basic types of electronic fare technologies that have been used for transit purposes: magnetic stripe cards (see Figure 22), smart cards (see Figure 23 and Figure 24), and mobile payment. The term smart card refers to an integrated circuit (or chip) card that has a microprocessor and built-in logic. However, the term has come to be used to generally describe a range of automated types of card technologies, including memory cards (without microprocessors) and radio frequency identification (RFID) cards/tags (also often without microprocessors). "Transit agencies in the US are implementing QR code and [Near Field Communication] NFC mobile platforms for transit payments. Mobile ticketing apps using visual and QR code validation are software-based and relatively easy to deploy."37
There are three types of smart cards: contact, contactless, and combi-card (or dual interface card). Contact cards require a physical contact between the card and the read/write unit, and must be inserted into a slot. Contactless cards (the CharlieCard and SmarTrip cards shown in Figure 23 and Figure 24, respectively) do not have to be inserted into a slot, but rather can be read by passing the card close to the read/write unit. Contactless cards use a contactless interface either to provide power to the card and transfer data using inductive and capacitive techniques or to transfer data between the card and the read/write unit using radio frequency techniques (power is supplied using a battery or by means of received magnetic energy). Combi-cards combine the attributes of contact and contactless cards by using either two separate chips or a single chip capable of being accessed in either fashion.
Electronic fare media can readily accommodate options such as stored value, stored trip, various lengths of passes, and capped-trip passes. It can also facilitate more convenient payment of transfers than in token- and cash-based systems. Improvements in these technologies can contribute to improvements in revenue control, data collection, and integration of different operators or types of service. Choice of a particular technology can affect both the efficiency of the fare collection functions and the range of feasible payment options.
Automated fare payment provides convenience for the customer in terms of payment options, but also benefits customers by speeding the fare payment process, thus reducing queuing time and resulting in less time for the transit vehicle to remain stopped. The less time stopped boarding customers, the better the chance of an on-time service delivery.
Further, automated fare payment reduces the cost of fare collection for a transit authority. Cash fares normally involve tokens, coins, and small bills. This results in high fare collection processing cost due to the relatively small value but high-volume transactions. Also, this small value but high volume of cash transactions has a high level of "wear and tear" on the fare collection equipment.
As mentioned earlier, mobile transit payments are now being implemented in transit agencies in the United States. For example, the Massachusetts Bay Transit Authority (MBTA) introduced the mTicket mobile ticketing application for iPhone and Android smartphones in 2012. Information on how to use this mobile ticketing application can be found at www.youtube.com/watch?v=C1l5MxnHR3c.
Automated fare payment systems that cover multiple transit providers have the following benefits:
- Ensure that multiple carriers charge the appropriate fare if they are governed by a particular fare policy. For example, if there are three contractors operating a particular service, and they all must comply with the fare policy for the agency they are working for, an automated system could be used to ensure that each carrier charges and collects the appropriate fare from their customers.
- Facilitate fare payment for customers using multiple carriers. This means that passengers do not have to carry multiple fare cards, different types of tokens, or cash to pay the fare on different carriers.
- Ensure the proper distribution of fares to agencies that are using the same fare media, including the situation when the transfer among agencies is discounted.
- Facilitate more sophisticated fare structures. This type of an automated system can easily keep track of complex fare structures that are needed to accommodate different types of transit services provided in a region or even by the same agency (e.g., traditional fixed-route, paratransit, and flexible services).
Currently, there are several major regional fare payment systems that cover multiple transit providers including the Clipper® card in the San Francisco Bay area (covers 8 transit providers), the ORCA card in the Seattle area (covers 7 transit providers), and SmarTrip® in the Washington, DC, area (covers 10 transit providers).
Automated Fareboxes and Faregates
Automated fareboxes and faregates are integral parts of automated fare collection systems. There are four types of fare collection, two of which use fareboxes and faregates, as follows:38
- Barrier (i.e., pay on entering and/or exiting a station or loading area). Involves turnstiles, faregates, and ticket agents or some combination of all three; may involve entry control only or entry and exit control, particularly for a distance-based system.
- Pay on boarding (i.e., on entering the vehicle). Typically involves a farebox or a ticket or card processing unit.
- Self-service/barrier-free or proof of payment (POP). The rider is required to carry a valid ticket or pass when on the vehicle and is subject to random inspection by roving inspectors; typically involves ticket vending/validating machines (see next section in this module).
- Conductor-validated. The rider can either prepay or buy a ticket onboard from a conductor
A decision on fare payment technology is separate from choosing a basic fare collection approach. However, the type of technology selected can have definite implications on the approach. For barrier, pay on boarding, and conductor validated systems, the major implication of electronic payment is the need for appropriate equipment (e.g., magnetic/smart card readers and vending/add-value machines for barrier and pay on boarding, hand-held readers for conductor validated).39
Automated faregates or fareboxes identify the validity of the farecard and, for a stored-value card, deduct the proper fare value. Further, some state-of-the-art fare collection systems require a communications backbone to provide real-time communications for activities such as credit card verification and equipment status monitoring.
When the MBTA implemented a new automated fare collection system, new automated fareboxes and faregates were introduced on the bus and light rail, and subway systems, respectively. Figure 25 and Figure 26 show the automated farebox, and Figure 27 shows the automated faregate.
Figure 25. MBTA Automated Farebox with Smartcard Target Highlighted
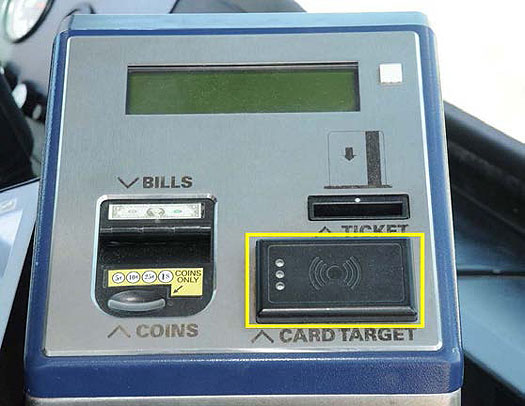
Source: MBTA.
Figure 26. MBTA Automated Farebox with Magnetic-Stripe Card Being Used
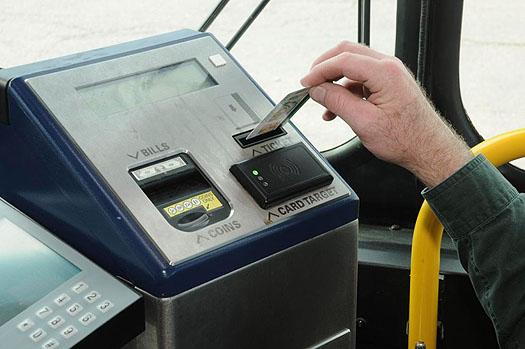
Source: MBTA.
Figure 27. MBTA Automated Faregate
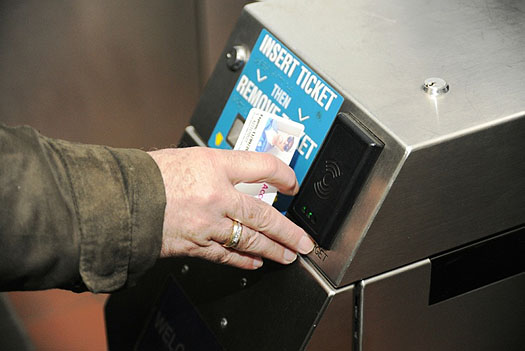
Source: MBTA.
Ticket Vending Machines (TVMs)
TVMs are used by many transit agencies to dispense various types of fare payment media. The types of transactions that can be performed by TVMs are as follows:40
- Accept coins only
- Accept bills and coins
- Accept credit cards
- Accept debit cards
- Make bill change
- Accept tokens
- Accept paper coupons
- Validate vouchers
- Reload smart cards
The types of fare media issued by TVMs are as follows:
- Single ride
- Round trip
- Day pass
- Monthly pass
- Multiple-day pass
- Multiple-ride pass
- Stored-value fare card
- Reload stored-value fare card
"In the spring of 2005, CARTA deployed five TVMs along with a central TVM management server application to support the Incline Railway operation. The TVMs accept both cash and credit cards. The use of TVMs allowed CARTA to migrate from its former paper-based system for tracking Incline Railway ticket sales to an automated system that integrated with its data warehouse."41
Return to top ↑
Maintenance
Engine and Drivetrain Systems Monitoring (aka Vehicle Component Monitoring)
The FTA’s State of Good Repair Program is an initiative dedicated to repairing and upgrading bus and rail systems. Maintenance technology facilitates activities that are supported by this program. VCM is an example of maintenance technology.
In-vehicle diagnostics system that monitors conditions of transit vehicle components, especially the engines, and provides failure warnings. Out-of-tolerance conditions may be passed on to dispatch in real time using a radio data connection between the transit vehicle and central control or downloaded during vehicle servicing at the transit garage. This system includes software that manages the maintenance records of each transit vehicle and parts inventories. This type of system is also known as Vehicle Component Monitoring [VCM], Automatic Vehicle Monitoring, and Maintenance Tracking.42
A VCM system, which can be a key component of a maintenance management system, is a set of sensors that monitor various components of the vehicle and report back on components performance. Components such as engine, transmission, anti-lock brakes, and various fluid levels are constantly monitored. By keeping track of these components, maintenance supervisors can use this information to perform preventive maintenance intervention before a minor problem becomes a major and costly one. Unlike an APC system—where ridership data is downloaded at the end of the day—vehicle component monitoring is performed in real time and problems are reported instantly.
In addition to preventing a minor problem from becoming a major and costly one, engine monitoring allows a transit agency to remove a vehicle from service before a breakdown that interrupts the travel of potentially hundreds of people. A high-capacity transit bus on a route with a high level of turnover may service several hundred people from the start to the stop of a single run. A disabled bus that cannot provide service on that one run will cause missed trips and frustration and, in some cases, forces commuters to miss the start of a work shift.
Beginning in 2006, CARTA required the inclusion of a multiplex system on all buses purchased. This system connected to the J1939 data bus; monitored common engine, transmission, and braking faults transmitted on the data bus (e.g., high engine oil temperature, low oil pressure, high transmission oil temperature); and logged the data for later retrieval. The main purpose of this system was for integration with other planned in-vehicle equipment to eventually provide CARTA with a full remote diagnostics maintenance system. The system is now operational. In 2009, CARTA implemented the daily upload via WLAN of bus diagnostic information collected onboard to the [Automatic Vehicle Monitoring] AVM server, making this data available to maintenance staff. Prior to this, CARTA deployed onboard components for an Automatic Vehicle Monitoring (AVM) system on fixed route vehicles, including wireless local area networks (WLAN) communications at both vehicle storage facilities to enable bulk data transfer with vehicles.43
Return to top ↑
Other
Data Management
A paper written for the 2012 ITS World Congress in Vienna, Austria,44 describes the current thinking about transit ITS data management. Public transit ITS components installed in vehicles, at central locations (e.g., control centers), or at other locations (e.g., stops and shelters) generate an enormous amount of data typically collected and archived in the individual databases of systems that generate the data indicated in Figure 28. The extent of field data collected on-board vehicles depends on the configuration of the ITS systems and subsystems on vehicles or at other locations (e.g., refresh rate of automatic vehicle location (AVL) subsystem, recording rate of on-board video surveillance subsystem and health diagnostics, refresh rate for off-site equipment). Once the ITS data is archived, it is used for a variety of "after-the-fact" analyses and reporting by different business units within a public transport organization (e.g., planning, operations, customer service).
Figure 28. Public Transport ITS System Environment
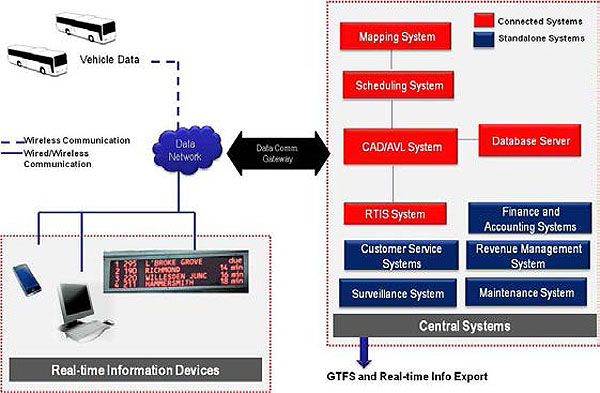
(Extended Text Description: This is a text graphic to demonstrate the public transportation ITS system environment. There are two bus icons in the upper left corner with the words Vehicle data and a dotted blue line representing wireless communication leading to a cloud shape labeled Data Network. This cloud is connected via a solid blue line representing wired/wireless communication to the images of a smart phone, a computer and a dynamic display sign, all in a box labeled Real-time Information Devices. This area relates to the right side of the graphic via a wide bi-directional labeled Data Comm Gateway. On the right side is a flow chart of text boxes. Red boxes represent connected systems, blue boxes represent standalone systems. At the top, a box in red is labeled Mapping System with leads to a red box labeled Scheduling System which is connected to a red box labeled CAD/AVL System. This box is connected to another red box labeled Database Server and another labeled RTIS System. The standalone boxes (in blue) are labeled: Customer Service Systems, Surveillance System, Finance and Accounting Systems, Revenue Management System, and Maintenance System. At the bottom is a gray text box labeled Central Systems with a blue arrow pointing to the words GTFS and Real-time Info Export.)
The maintenance of archived databases for individual systems requires a large amount of agency resources (e.g., staff commitment in terms of hours, physical servers) and can at times be cost-prohibitive. Given the more widespread adoption of technological advances in recent years, such as server virtualization and cloud computing, public transport organizations have been trying to utilize the true potential of the ITS data by consolidating data in a central repository to make the process of data management, analysis, and reporting more efficient.
The approach can be described as follows:
- Demand - the identification and prioritization of stakeholder (various business units within an organization) and external data needs. This step is the foundation for developing the data management and analysis framework and tools. Typically, the needs assessment that is conducted is not comprehensive enough to address enterprise-wide data needs. This results in multiple data repositories with redundant data structures, resulting in duplicate data management systems within an organization.
- Dimension - the identification of archived ITS data elements and their characteristics that are of interest to the stakeholders. Archived ITS data is spatial-temporal in nature and typically has three major dimensions:
- Event (e.g., driver logon/logoff, route or schedule deviation, passenger boarding, incident, accident, voice call);
- Time (i.e., date and time an event occurred); and
- Space (e.g., route, stop, timepoint, and transfer point).
Stakeholders must be engaged in detailed discussions to analyze which of these dimensions and their corresponding details are critical for meeting their business needs. Results of these analyses should be used to determine the data structure of data warehouses and datamarts.
This approach should be customized according to the existing environment within a public transport organization.
The presence of a data warehouse at CARTA simplified other deployments in two ways. First, the data warehouse provided reporting tools, which eliminated the need for sophisticated reporting tools in other CARTA applications. Second, applications could be integrated with the data warehouse, reducing the total number of interfaces that were required.45
Figure 29. Illustration of Typical Datawarehouse and Datamart Configurations
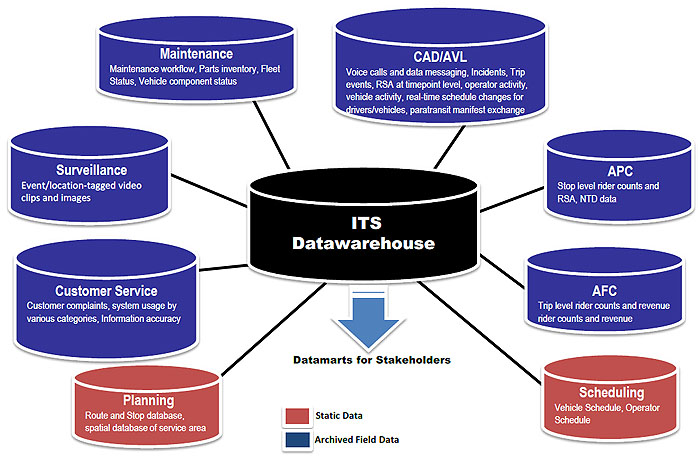
(Extended Text Description: This is a text graphic demonstrating the relationship of typical datawarehouse and datamart configurations. Items in red are identified as Static Data and items in blue are identified as Archived Field Data, and the entire graphic is labeled Technology Integration. At the center is a black cylinder labeled ITS Datawarehouse with a blue arrow pointing down to the words Datamarts for Stakeholders. Starting at the bottom left and moving clockwise, the following elements surround the central ITS Datawarehouse, and are connected to it with a black line to it from each element. The first (in a red cylinder shape) is Planning: Route and Stop database, spatial database of service area. The second (in a blue cylinder shape) is Customer Service: Customer complaints, system usage by various categories, Information accuracy. The third (blue) is Surveillance: Event/location-tagged video clips and images. The fourth (blue) is Maintenance: Maintenance workflow, Parts inventory, Fleet Status, Vehicle components status. The fifth (blue) is CAD/AVL: Voice calls and data messaging, Incidents, Trip events, RSA at timepoint level, operator activity, vehicle activity, real-time schedule changes for drivers/vehicles, paratransit manifest exchange. The sixth (blue) is APC: Stop level rider counts and RSA, NTD data. The seventh (blue) is AFC: Trip level rider counts and revenue rider counts and revenue. The eighth (red) is Scheduling: Vehicle Schedule, Operator Schedule.)
Technology Integration
As discussed at the beginning of this module, many transit ITS technologies are dependent upon each other to function. Further, there are opportunities for technologies to be integrated with systems that are external to a transit agency, such as a regional traffic management center or an information services provider. Thus,…
…integration, when implemented from an enterprise-wide perspective and a regional perspective when appropriate, improves the overall usability of a technology environment made up of products from many different vendors on multiple platforms and data from many different systems. Integration is also valuable to transit ITS in that it facilitates a ‘system’ of interconnected ITS applications that collectively produce services and advantages far greater than the ITS applications could achieve independently.46
The importance of integration can be described when the following example is reviewed. Disparate systems each with its own GPS unit can lead to conflicting location stamps in systems depending on when each GPS was polled. This is a minor issue when comparing the AVL location to the location stamp on a digital video recording, but can be a major issue with precision docking or Connected Vehicle technology. Different system times, even if they are related to the time zone setting, can cause archived data to show the vehicle in two different locations at the same time. The more systems are integrated and use a single data source, the more that the information will be consistent and synchronized. Also, this is important as transit technology systems are interfaced with non-transit systems.
Table 3 shows examples of the integration within a transit agency of various technologies. ITS standards facilitate this integration. Standards that are typically used include Society of Automotive Engineers (SAE) J1708 and J1939 (vehicle area network [VAN] standards), Transit Communications Interface Profiles (TCIP), General Transit Feed Specification (GTFS), GTFS-real time, Service Interface for Real Time Information (SIRI) and several others.
Table 3. Examples of Integration Among Transit ITS Components
| Component |
Integrated with Component |
| APC system |
CAD/AVL |
| APC system |
Wheelchair lift sensor |
| APC system |
WLAN |
| AVA system |
CAD/AVL |
| AVA system |
Interior DMS |
| AVA system |
WLAN |
| CAD/AVL |
Communication system(s) |
| CAD/AVL |
MDT via communication system(s) |
| CAD/AVL |
Google Transit |
| CAD/AVL |
MDT |
| CAD/AVL |
WLAN |
| CAD/AVL |
IVR system |
| G-Force Sensor System |
Collision avoidance system |
| G-Force Sensor System |
CAD/AVL |
| G-Force Sensor System |
On-board video surveillance |
| IVR system |
Telephone system |
| MDT |
Farebox |
| MDT |
Headsigns |
| MDT |
Interior DMS and interior public address speakers |
| MDT |
Odometer |
| MDT |
APC system |
| MDT |
On-board surveillance system |
| Scheduling system |
Google Transit |
| Vehicle component monitoring |
On-board multiplex and powertrain systems |
| Vehicle component monitoring |
Wireless data exchange software |
| Wayside DMS |
Communication system |
Geographic Information Systems (GIS)
GIS are computer software programs that provide database management capabilities for the display and editing of geographically referenced entities and underlying attribute data. Databases most relevant to transit are streets and highways, operational facilities, layover locations, passenger facilities including multimodal centers, bus stops and shelters, designated transfer points, and major landmarks. GIS provides the ability to perform analyses of geographic features such as point databases (bus stops, communications transmitters, customer facilities), lines (streets, bus routes, subway tracks, rights-of-way), and areas (census tracks, census blocks, traffic analysis zones, zip codes). These analyses can combine multiple geographic layers to answer such questions as how many transit dependent households are located in a selected census tract of a county or to identify locations where communications should be provided in languages other than English.
GIS combines the ability to accurately map geographically referenced data and to create themes such as employment density by traffic analysis zone or mobility limited persons by block group. Further, GIS allows transit agencies to analyze the potential effects of adding, removing, or rerouting service.
GIS has been used to support the trip itinerary planning software, the flexible routing and scheduling software required in the paratransit industry, and the real-time vehicle location components of operations software.
Figure 30 shows a GIS used to display paratransit origins and destinations in Hyannis, MA, community on Cape Cod. This data could be used to justify the creation of one or more fixed routes that cover most of the paratransit origins and destinations.
Figure 30. Use of GIS
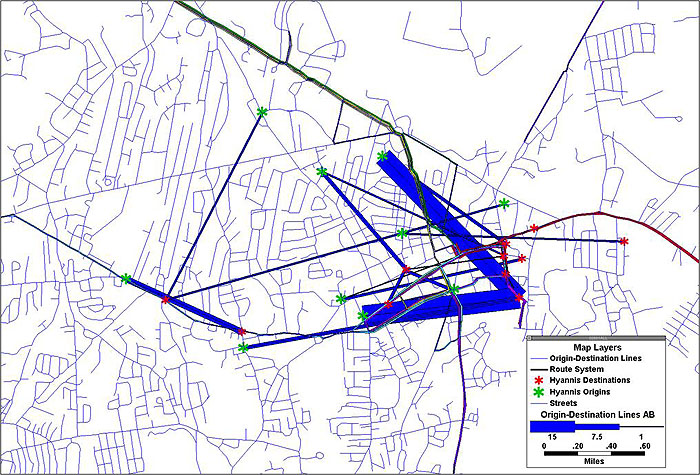
(Extended Text Description: This image shows the paratransit origins and destinations in Hyannis, MA. This GIS data could be used to justify the creation of one or more fixed routes that cover most of the paratransit origins and destinations. In this image, a roadmap of the Hyannis area is shown. Origin-destination lines appear in light blue. A thin black line represents the Route system. Hyannis destinations are identified with red asterisks. Hyannis origins are marked with green asterisks. Red asterisks are scattered yet more concentrated in the center right of the map. Green asterisks are equally scattered around the map. A dark blue line indicates the number of Origin-Destination Lines AB. Dark blue lines of varying thickness appear connecting various red and green asterisks around the map. The thickest of the blue lines form a "V" shape pointing to a single red asterisk just right of the center of the image.)
Another example of the use of GIS is by Cotton Express, which provides fixed route and paratransit services for the city of Coolidge, AZ. The city runs three fixed routes, using nine buses. Cotton Express uses GIS to plan the routes and operates a regional route between Florence (commuter traffic to county jobs) and Casa Grande (shopping district and hospital). Located in the middle of these cities, Coolidge controls the regional route and acts as a "hub," taking input from the cities regarding ridership concerns, routes, etc. Cotton Express hopes to expand the route north (Sacaton) and south (Eloy) of Coolidge.
Cotton Express also uses GIS to create maps for print, route and timetable planning, brochures, and schedules. For example, by knowing the distance between stops, speed limits, and traffic control, travelers can quickly calculate the times between stops along the route. All preparation and printing of literature is preformed in-house and distributed around town and to employment centers on the routes.
Service Coordination Facilitated by Technology
The use of technology to facilitate the coordination of transportation services has been the focus of the Mobility for All Americans (MSAA) initiative, which was initiated in 2005 by the ITS Joint Program Office (JPO), part of the USDOT, Research and Innovative Technology Administration (RITA) (which is now the Office of the Assistant Secretary for Research and Technology). This program, which completed its third phase in 2012 and just started a new round of grants in October 2015, has funded the demonstration of this concept by several transit agencies/organizations. The first phase was conducting the foundation research that identified the most appropriate technology to facilitate the development of transportation management coordination centers (TMCCs) and developed a Concept of Operations. The second phase funded the definition of TMCCs by eight grantees. These grantees were required to use a systems engineering approach to define the TMCCs. The third phase funded the actual deployment of TMCCs by three transportation agencies. The current MSAA effort that started in October 2015 is funding the development of technology to facilitate service coordination at three sites around the country.
The foundations of the original MSAA program are best described in the following videos:
The ITS JPO is in the process of updating a report that describes the results of the first MSAA initiative.47 The following summary and description of one of the three MSAA TMCC sites comes directly from this report:
The Mobility Services for All Americans (MSAA) Initiative48 address[es] the coordination challenge by using technology. The MSAA Initiative is a research and demonstration program of the U.S. Department of Transportation (U.S. DOT). Started in 2005, the MSAA initiative was built upon several past and current U.S. DOT-led activities, including the U.S. DOT’s United We Ride Program. The goal of the MSAA Initiative was to increase mobility and accessibility for the transportation-disadvantaged and the general public, and achieve more efficient use of Federal transportation funding resources through technology integration and service coordination.
Intelligent Transportation Systems (ITS) present the opportunity to seamlessly connect customers, agencies, and transportation providers by providing a single point of access for the customer and greatly enhancing the effectiveness and efficiency of the mobility services offered to the disadvantaged and to the general public. Through the application of ITS, the MSAA Initiative is providing the technological backbone to realize this vision. The key to enabling such effective and efficient coordination is the integration of ITS technologies into a physical or virtual Travel Management Coordination Center (TMCC) that networks all parties together and uses ITS technologies that are tested and proven and have demonstrated significant benefits and return on investment based on empirical evidence. Such technologies include, among others:
- Fleet scheduling, dispatching, and routing systems;
- Enhanced telephone and internet-based traveler information and trip planning systems, particularly for customers with accessibility challenges;
- Automatic Vehicle Location (AVL) and other systems that assist the operations of demand-response door-to-door service; and
- Integrated fare payment and management (payment, collection, and processing) systems.
The MSAA Initiative has three major objectives. These are:
- to establish a comprehensive set of transportation services to meet the full range of transportation needs for all, including low-income individuals, older adults, and persons with disabilities in a target area by coordinating the resources of various human service and transit programs;
- to simplify points of access for consumers to obtain the transportation services needed from various programs; and
- to use intelligent transportation systems to enhance transportation service delivery and system accessibility.
Aiken, SC is one of the MSAA demonstration sites selected for the planning and deployment of a TMCC, and is the site that has progressed the most fully in its deployment. The first phase of operations of the Aiken TMCC was launched in 2010, and it has received much attention for its success, including serving as one of the case study sites for the One Call-One Click program49.
There is no one size-fits-all design for a TMCC, and Aiken represents only one possible configuration for a TMCC. The purpose for implementing the system was to continue to work toward the vision of developing a regional system of centrally coordinated transportation. The Lower Savannah COG has served as the lead agency pursuing this vision for several years and strived to achieve the following:
- Easing consumer access to knowledge of and access to transportation information and resources
- Improving coordination across multiple funding sources, programs and jurisdictions
- Improving coordination among transportation providers
- Developing a regionally coordinated transportation system that appears more seamless to consumers and efficiently meets consumer needs
Operations of the TMCC and increased coordination among providers of transportation services in the region helped the system to better meet needs which were un-met previous to the MSAA project.
More generally, technologies that have been described earlier in this module can facilitate human services transportation. Table 4 describes those technologies that are most beneficial to human service agencies and customers.50
Table 4. ITS Technologies that Benefit Transportation-Disadvantaged Populations
| Technology |
Purpose |
| Passenger-related technologies |
|
Traveler information
- Internet websites
- Automated telephone systems
- Audible enunciators
- Kiosks
- Transit stops with automated information
|
Advanced traveler information systems (ATIS) provide the customer (i.e., transit passenger) with traveler information electronically. The information may be static or real-time. The content might include schedules, fares, routes, transfers, arrival time of next vehicle, and/or availability of special accommodation equipment. Information can be provided on the transit vehicle, at the transit stop, available through the Internet or over the telephone. Automated travel itinerary planners are included in this category. |
| Electronic fare payment |
This technology allows the rider or human services agency to pay for transportation services on one or more transit systems electronically using a smart card or magnetic stripe card. While the passenger sees only the card, the operational component uses the data to simplify billing and payment. |
| Surveillance and security systems |
Safety and security technologies include video surveillance cameras, silent alarms and covert microphones on vehicles, and "smart" cards for driver identification. Surveillance and security systems can be provided in transit vehicles and at transit stops and stations. |
| Global positioning system (GPS) assistive technology |
There are several GPS-based technologies that assist persons with visual impairments to navigate within their surroundings. For example, one type of system has a talking GPS unit that provides positioning functionality, allowing those with visual impairments to become familiar with a specific location and surrounding area. |
| Organization-related technologies |
| Automatic Vehicle Location |
Using a positioning system, such as the global positioning system (GPS), and a GIS, the operating agency can track its buses. Combining AVL with ATIS, the agency can alert riders with real-time information; combining AVL with CAD, the agency can reroute vehicles to provide flexible service. |
| Computer-Aided Dispatch |
CAD is used to assist agencies in dispatching Paratransit vehicles and is typically integrated with AVL and other information management technologies, such as scheduling and routing software. |
| Mobile Data Terminals/Mobile Data Computers |
An MDT/MDC is a small on-board computer and interface that links the driver to an agency’s computer network through wireless communications. |
| Coordination and integration software |
This technology helps agencies with scheduling, routing, billing, and reporting. Typical applications include coordinating paratransit routes and schedules within a single agency or among multiple agencies, coordinating fare card usage and billing among multiple agencies, and integrating software systems across multimodal transit systems. |
Open Data
Open data is defined as meeting the following criteria:
- Accessible (ideally via the internet) at no more than the cost of reproduction, without limitations based on user identity or intent;
- In a digital, machine readable format for interoperation with
other data; and
- Free of restriction on use or redistribution in its licensing conditions.51
Guidance regarding open transit data can be found in TCRP Synthesis 115.52
As of 2014, City-Go-Round (www.citygoround.org/) reported that of the 1,026 transit agencies they have in their database (864 of those are in the U.S.), 292 have open data (248 in the U.S.). City-Go-Round defines having open data as providing transit data in GTFS format.
The process for agencies to provide open data includes exporting their data using the GTFS or GTFS-realtime (see https://developers.google.com/transit/gtfs/ and https://developers.google.com/transit/gtfs-realtime/, respectively). GTFS is a widely accepted format for publishing transit data, and allows agencies to be included on Google Transit. Once the data is exported, an agency either makes it available via a developer website (within the agency website) or places the data on another website that will host the data feed. Many agencies create a license agreement or terms of use to govern how data can be used by developers. Finally, agencies need to keep developers aware of changes to schedule data and other pertinent information so third-party applications are providing accurate information.
There are several examples of transit agencies that have embraced open data. Tri-Met in Portland, OR, led the transit industry moving into open data. At the same time TriMet embraced an open data approach, they were focusing on ensuring that their data (including real-time information) was in good shape to be used by others. Their work on using a centralized data approach, which TriMet calls centralized enterprise data system, led to the ability to easily extract data for almost any purpose. Not only did it help in providing customer information, but it was being used to make decisions about where to place shelters, what services to provide, etc.
Further, at the end of 2009, the Massachusetts Department of Transportation (MassDOT),…
…launched the first phase of its open data initiative by releasing real-time information for five bus routes. The data released to software developers included real-time GPS locations of buses and arrival countdown information for every bus route. Within just one hour of releasing this data, a developer built an application showing real-time bus positions. Within two months, more than a dozen applications had been created including websites, smart phone applications, SMS text message services, and 617-phone numbers. All of these applications were created at no cost to MassDOT or the MBTA. In his first week on the job, MassDOT Transit Division Administrator and MBTA General Manager Richard Davey announced that real-time data would be provided for all routes throughout the entire bus system. The expanded rollout began in June and was completed yesterday [September 8, 2010].53
Finally, earlier in this module there was a description of the DMS developed and deployed by Mobility Lab. A DMS is driven by the open data that is provided by the participating agencies. Each set of open data is in the GTFS-real-time format. This means that any person or entity that can develop an application based on open transportation data can install signs and provide real-time information anywhere real-time open data is available. For example, Mobility Lab worked closely with Capital Bikeshare, which is the only open data bikeshare system in the United States. (London, United Kingdom, provided open bikeshare data before Capital Bikeshare.)
Return to top ↑
Summary
Transit ITS includes numerous on-board and centralized technologies that are used to improve operations, maintenance, customer service, and customer convenience. As discussed in the individual parts of this module, there are numerous benefits to deploying these technologies, but it is critical that the dependencies among the components are considered when an agency is planning a technology program. A transit ITS strategy should consider a phased implementation so that the baseline technologies are implemented and operate well before adding other technologies. For example, before providing real-time information to the public, it is imperative that the AVL system that generates information used to predict real-time arrivals/departures is operating properly and generating accurate information.
Transit ITS continues to improve in terms of systems integration and new technologies. While vendor products still tend to be proprietary, various aspects of their products have become open. For example, paratransit scheduling software vendors are incorporating commercially available MDTs (e.g., tablet computers) into their systems. Further, there are more open systems being developed. For example, OneBusAway, a mobile application originally developed at the University of Washington, is based on open-source software.
Many transit agencies are facing the retirement and replacement of technologies that have reached the end of their useful life. Thus, agencies are assessing new technologies for deployment. This assessment should include the following steps:54
- Identify current issues that need to be addressed over a strategic planning period (typically 5 to 10 years). This step includes conducting an inventory of existing technologies and interviewing staff that uses the existing technologies to determine their usefulness, usability, and the potential to integrate these legacy systems with new technologies;
- Examine the agency’s (and its departments’) goals and objectives, which will provide insight into expanded or modified transit services, policies, and procedures that can be facilitated by the deployment of new technology or replacement of old technology;
- Assess the agency’s structure to understand the functions performed by each department within the agency and the relationship among all departments. Entities outside the transit agency that have or will have operational, customer, and/or institutional relationships should also be identified at this point;
- Identify existing and desired data flows among all agency functions and between agency functional entities and external organizations. The purpose of this step is to define information requirements, flows, and interfaces for each agency functional or "user" group, recognizing their different functions and interdependence;
- Identify technologies that will address the agency’s current issues and goals;
- Develop technology recommendations based upon the results of previous steps;
- Obtain support from all parts of the agency, usually consisting of a facilitated discussion about the recommended technologies; and
- Determine the costs and benefits of the recommended technologies, and if and when funds will be available to implement them.
In terms of new technologies, mobile payment systems are becoming more mainstream. For example, the MBTA’s mTicket application allows customers to pay for commuter rail service via their smartphones. Further, the potential to connect travelers, infrastructure, and vehicles in order to provide the best possible public transportation options will be demonstrated as part of the IDTO portion of the USDOT Connected Vehicle Program.
This module provides the information necessary for transit and other transportation agencies to understand the range of transit technologies and how they are used. Also, it should facilitate conducting a needs assessment to determine the most appropriate technologies for implementation.
Return to top ↑
References
Return to top ↑
Additional Resources
APTA Standards Development Program, https://www.apta.com/research-technical-resources/standards/
Automatic Vehicle Location Fact Sheet: Fixed Route Bus Transit, September 2007
Barbeau, Sean, Miguel Labrador, Phil Winters, and Nevine Labib Georggi, Enhancing Transit Safety and Security with Wireless Detection and Communication Technologies, prepared for Florida Department of Transportation, November 2008, Report No. FDOT BD 549 WO45, www.nctr.usf.edu/pdf/77714.pdf- content is no longer available.
Boyle, Daniel, John Pappas, Phillip Boyle, Bonnie Nelson, David Sharfarz, and Howard Benn, TCRP Web-Only Document 45: Appendixes to TCRP Report 135: Controlling System Costs: Basic and Advanced Scheduling Manuals and Contemporary Issues in Transit Scheduling, Transit Cooperative Research Program, Transportation Research Board, Washington, DC, March 2009.
Boyle, Daniel, John Pappas, Phillip Boyle, Bonnie Nelson, David Sharfarz, and Howard Benn, TCRP Report 135 - Controlling System Costs: Basic and Advanced Scheduling Manuals and Contemporary Issues in Transit Scheduling, Transit Cooperative Research Program, Transportation Research Board, Washington, DC, 2009, https://www.trb.org/Publications/Blurbs/161864.aspx
Burt, Matthew W., Chris Cluett, Carol L. Schweiger, Matthew A. Coogan, Richard B. Easley, and Sharon Easley, Improving Public Transportation Technology Implementations And Anticipating Emerging Technologies (Report 84, Volume 8), Transit Cooperative Research Program Project J-09, Task 12, Transportation Research Board, Washington, DC, 2008, https://www.trb.org/Publications/Blurbs/156794.aspx
Buy an ORCA Card at a Ticket Vending Machine, www.youtube.com/watch?v=BTa1u36fBKk- content is no longer available.
Caltrain Audible Ticket Vending Machine, www.youtube.com/watch?v=6ixT3WgQxIw
Chu, Xuehao, A Guidebook for Using Automatic Passenger Counter Data for National Transit Database (NTD) Reporting, prepared for Research and Innovative Technology Administration and Florida Department of Transportation, December 2010.
Cluett, Chris, Susan Bregman and Joel Richman, Customer Preferences for Transit ATIS: Research Report, prepared for FTA, August 8, 2003, https://trid.trb.org/view/660989
Data Terminals, Transit Cooperative Research Program, Transportation Research Board, Washington, DC, 2007.
Harman, Lawrence J. and Uma Shama, TCRP Synthesis 70 - Mobile.
Jackson, David W., Charlotte Burger, Benjamin Cotton, Alex Linthicum, Luis Mejias, Terrance Regan, and Gina Filosa, "Traveler Information Systems and Wayfinding Technologies in Transit Systems: Summary of State-of-the-Practice and State-of-the-Art," May 2011, Report No.
FTA-MA-26-7998-2011.1
Kessler, David S., TCRP Synthesis 57: Computer-Aided Scheduling and Dispatch in Demand-Responsive Transit Services, Transit Cooperative Research Program, Transportation Research Board, Washington, DC, 2004, https://www.trb.org/Publications/Blurbs/155357.aspx
Kittelson & Associates, Inc., Herbert S. Levinson Transportation Consultants, and DMJM+Harris, TCRP Report 118 - Bus Rapid Transit Practitioner’s Guide, Transit Cooperative Research Program, Transportation Research Board, Washington, DC, 2007.
Korea’s Advanced Public Transportation System, www.youtube.com/watch?v=dt9-dWqyjxA- content is no longer available.
Masuda, Judi, How Technology Can Improve Public Transit, www.youtube.com/watch?v=XYT82S9G9H8
MBTA Answers Where’s the Bus?, www.youtube.com/watch?v=NmbPCH5BGeg
Quibria, Nasreen, "The Contactless Wave: A Case Study in Transit Payments," Federal Reserve Bank of Boston, 2008, http://floridaapts.lctr.org/E-library%20update%20in%20website/transit.pdf- content is no longer available.
Rainville, Lydia, Victoria Hsu, and Sean Peirce, "Electronic Fare Collection Options for Commuter Railroads," September 2009, Report No. FTA-MA-26-7109-2009.01
Raman, Mala, Khaled Shammout, and David Williams," Guidance for Developing and Deploying Real-time Traveler Information Systems for Transit," prepared for FTA and the ITS Joint Program Office, April 30, 2003, Report Numbers FTA-OH-26-7017-2003.1 and FHWA-OP-03-112, https://www.trb.org/Main/Blurbs/153014.aspx
Rao, Alan L., Ph.D., Recent Developments in Transit Communication Technologies, presented at 2011 Global Transport Forum on Transit Communications and Wireless Applications.
Research and Innovative Technology Administration, ITS
Schweiger, Carol L., TCRP Synthesis 115 - Open Data: Challenges and Opportunities for Transit Agencies, Transit Cooperative Research Program, Transportation Research Board, Washington, DC, 2015, https://www.trb.org/Publications/Blurbs/172202.aspx
Schweiger, Carol L., TCRP Synthesis 104 - Use of Electronic Passenger Information Signage in Transit, Transit Cooperative Research Program, Transportation Research Board, Washington, DC, 2013, https://www.trb.org/Publications/Blurbs/169022.aspx
Schweiger, Carol L., TCRP Synthesis 48 - Real-Time Bus Arrival Information Systems, Transit Cooperative Research Program, Transportation Research Board, Washington, DC, 2003, https://gulliver.trb.org/publications/tcrp/tcrp_syn_48.pdf. (Content no longer available here.)
Schweiger, Carol L., TCRP Report 92 - Strategies for Improved Traveler Information, Transit Cooperative Research Program, Transportation Research Board, Washington, DC, 2003, https://onlinepubs.trb.org/onlinepubs/tcrp/tcrp_rpt_92.pdf
Schweiger, Carol L., TCRP Synthesis 68 - Methods of Rider Communication, Transit Cooperative Research Program, Transportation Research Board, Washington, DC, 2006, https://gulliver.trb.org/publications/tcrp/tcrp_syn_68.pdf (Content no longer available here.)
SMART Automated Fare Box, www.youtube.com/watch?v=Si7x1Uyn-NU
TCRP Report 95 - Traveler Response to Transportation System Changes, Chapter 9 - Transit Scheduling and Frequency, Transit Cooperative Research Program, Transportation Research Board, Washington, DC, 2004, https://www.trb.org/Publications/Blurbs/154748.aspx
Unlock Real-time Information, www.youtube.com/watch?v=URmKRTU-hxQ
Using a Metrolink TVM (Ticket Vending Machine), www.youtube.com/watch?v=iE_VsgYV8-4
Wilson Consulting, Regional Transportation Authority Transfer Connection Protection (TCP) Project: Executive Summary, October 25, 1999, rtams.org/sites/default/files/digital_documents/RTA_TransferConnectionProtectionProject-FullReport_1999.pdf
Back to top