← Return to Module 7
ITS ePrimer Presentation
Module 7: Public Transportation
(Note: The following PowerPoint presentation is a supplement to the module.)
Slide 1: ITS ePrimer Module 7: Public Transportation

September 2013
Intelligent Transportation Systems Joint Program Office Research and Innovative Technology Administration, USDOT
Author Notes for Slide 1:
This is the first, title slide in all modules.
The following slides are in this order:
- Instructor
- Learning Objectives
- Content-related slide(s)
- Summary (what we have learned)
- References
- Questions?
This module is sponsored by the U.S. Department of Transportation’s ITS Professional Capacity Building (PCB) Program. The ITS PCB Program is part of the Office of the Assistant Secretary for Research and Technology’s ITS Joint Program Office.
Thank you for participating and we hope you find this module helpful.
Slide 2: Instructor

Carol L. Schweiger
President
Schweiger Consulting LLC
Boston, MA, USA
Slide 3: Learning Objectives
- Understand public transportation technologies, how they function, and how they can be applied to facilitate or improve operations, customer service, and management
- Recognize the dependencies among specific technologies
- Understand the relationship between non-transit (e.g., highway-related) and transit technologies
- Realize the potential of transit ITS technologies to facilitate multimodal travel
Author Notes for Slide 3:
The learning objectives for this module are as follows:
- Understand public transportation technologies, how they function, and how they can be applied to facilitate or improve operations, customer service, and management;
- Recognize the dependencies among specific technologies;
- Understand the relationship between non-transit (e.g., highway-related) and transit technologies; and
- Realize the potential of transit ITS technologies to facilitate multimodal travel.
Slide 4: Module Organization
- Fleet Operations and Management - implemented to facilitate transit operations and provide input to senior management
- Traveler Information - customer-facing technologies that provide trip planning and real-time operational information
- Safety and Security - improve safety and security of transit staff and passengers
- Automated Fare Payment - fare collection and payment technologies
- Maintenance - facilitate maintenance activities
- Other - other technologies and systems, such as data management and the use of open data
Author Notes for Slide 4:
This module discusses technologies in six major categories that cover fixed-route, paratransit, and flexibly routed services, as follows:
Fleet Operations and Management - this category covers technologies that are implemented to facilitate transit operations and provide input to senior management in terms of overall system performance
Traveler Information - this category covers the customer-facing technologies that provide the public with information regarding trip planning and real-time operational information
Safety and Security - this category covers those technologies that improve the safety and security of transit staff and passengers through onboard and facility technologies
Automated Fare Payment - this category covers fare collection and payment technologies, including fare media and smartphone payment applications;
Maintenance - this category covers technologies that facilitate maintenance activities, such as engine and vehicle component monitoring, tracking of scheduled and unscheduled maintenance activities, and inventory systems
Other - this category covers a variety of other technologies and systems that do not fit into the other categories, such as data management and the use of open data
Slide 5: Transit ITS Deployment (1997-2010)
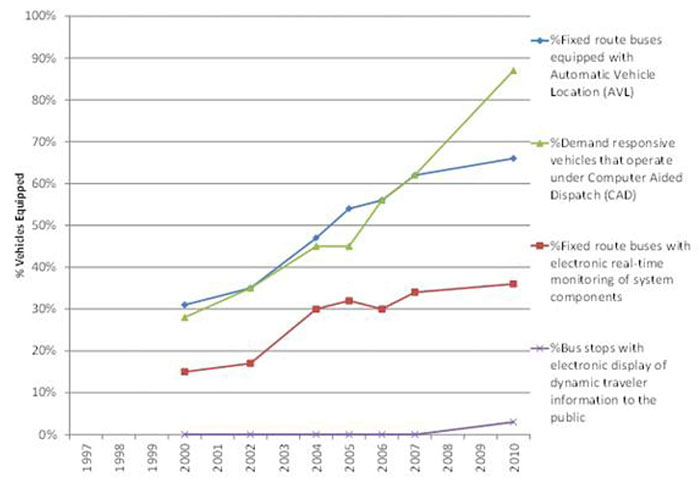
(Extended Text Description: This line graph shows the Transit ITS Deployment trends from 1997-2010. The x-axis represents the year in which the data was accumulated, going from 1997 to 2010. The y-axis represents the percentage of vehicles equipped, with measurements ranging from 0% where the two axes meet, to 100% in 10% intervals. The trending for four types of vehicles are represented on this graph. The following data points are represented as estimated trends - the original data is not available. The first vehicle trend is the percentage of fixed route buses equipped with Automatic Vehicle Location (AVL). This trend is noted in blue beginning at 30% in 2000. There is a fairly consistent upward trend for this vehicle type all the way through 2010, when it reached between 60-70% vehicles equipped. The second trend noted in green is the percentage of demand responsive vehicles that operate under Computer Aided Dispatch (CAD). Beginning in 2000 at just under 30% vehicles equipped, trended upward, with a brief plateau in 2005 between 40-50% before experiencing rapid growth to just under 90% vehicles equipped by 2010. The third trend noted in red is the percentage of fixed route buses with electronic real-time monitoring of system components. Beginning in 2000 with between 10-20% vehicles equipped, this vehicle type had an aggressive rise to 30% in 2004 before experiencing a gentler upward trend to between 30-40% by 2010. The final vehicle trend, noted in purple, is the percentage of bus stops with electronic display of dynamic traveler information to the public. Starting at 0% in 2000, this vehicle type began to take off in 2007, reaching between 0-10% vehicles equipped by 2010. For additional information regarding the content of this graph, please see the Author Notes below.)
Author Notes for Slide 5:
This figure shows the deployment trends for some of the most prevalent transit technologies from 1997 to 2010. Four major trends are displayed in this figure: percent of fixed-route vehicles equipped with automatic vehicle location (AVL), percent of fixed-route buses with electronic real-time monitoring of system components, percent of demand responsive vehicles that operate using computer-aided dispatch (CAD), and percent of transit stops with an electronic display of dynamic traveler information to the public.
Audience Interaction: Instructor asks participants if they have any personal experience with any of the four technologies/systems shown in the graph.
Image Source: Graphic from https://www.itskrs.its.dot.gov/deployment
Slide 6: Example of Central System Technology Relationships
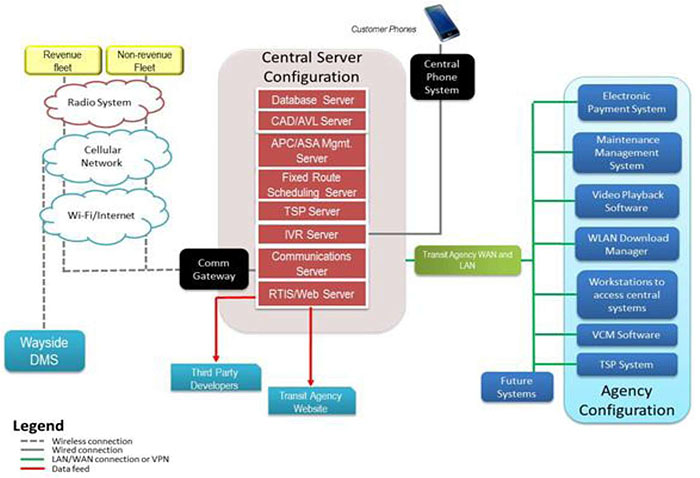
(Extended Text Description: This graphic shows the relationships among various Central System Technologies. Beginning in the center of the graphic, there is a red rectangular column representing the Central Server Configuration. In this column the following servers are represented in individual blocks from top to bottom: Database Server, CAD/AVL (Computer Aided Dispatch and Automatic Vehicle Location) Server, APC/ASA Mgmt. Server, Fixed Route Scheduling Server, TSP Server, IVR Server, Communications Server, and RTIS/Web Server. From the IVR Server, there is a gray line representing a wired connection that leads to a black box labeled "Central Phone System" with a smart phone icon above it. From the RTIS/Web Server, a red line representing data feed points down to a blue box labeled "Transit Agency Website." Coming from the left side of the RTIS/Web Server is another line pointing to blue box labeled "Third Party Developers." From the left side of the Communications Server, there is a dotted gray line that goes to a black box labeled "Comm Gateway" and branches upwards through three cloud networks (bottom to top: the Wi-Fi/Internet, Cellular Network, and Radio systems), going on to two separate yellow boxes. These boxes are labeled "Revenue Fleet" and "Non-revenue Fleet." From the Cellular network cloud, there is another dotted gray line going downwards representing the wireless connection to the Wayside DMS. Coming from the entire Central Server Configuration, there is a solid green line representing the LAN/WAN connection or VPN. This line goes through a light green box labeled "Transit Agency WAN and LAN" and branches out to a light blue section identified as the "Agency Configuration." Within the "Agency Configuration," the following items are represented in individual dark blue boxes (top to bottom): Electronic Payment System, Maintenance Management System, Video Playback Software, WLAN Download Manager, Workstations to access central systems, VCM Software, and TSP System. Outside the "Agency Configuration," the LAN/WAN connection also leads to a dark blue box labeled as "Future Systems.")
Author Notes for Slide 6:
This figure shows an example of the relationships among various transit ITS technologies at a central/dispatch location. Many of the technologies shown on this slide will be described in this module.
Image Source: Graphic courtesy TranSystems Corporation
Slide 7: Example of Onboard Technology Relationships
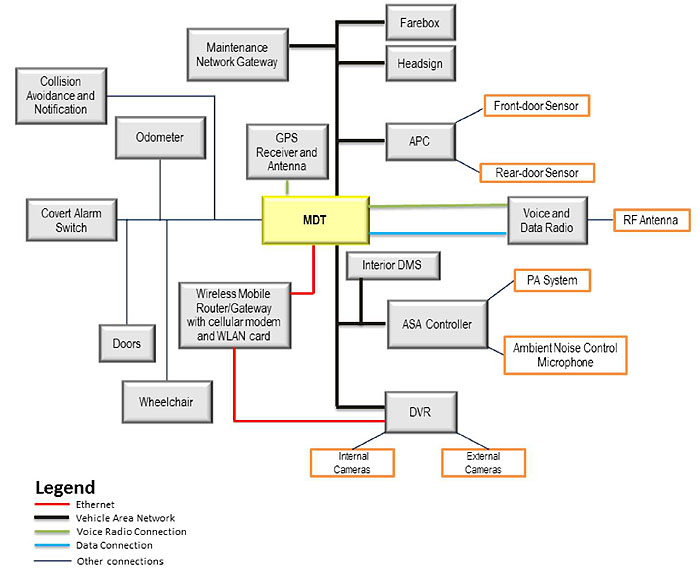
(Extended Text Description: This graphic shows an example of the relationships among various ITS technologies onboard a vehicle. In the center of the diagram is a box labeled MDT (Mobile Data Terminal). Coming from the top of MDT, is a box labeled "GPS Receiver and Antenna" connected via a voice radio connection. Connected to the MDT via a vehicle area network are the Maintenance Network Gateway, farebox, headsign and APC. The APC is connected to the front-door sensor and rear-door sensor via an alternative link. Utilizing both a Voice Radio Connection and a Data Connection, the MDT is connected to the Voice and Data Radio. This is then connected to the RF antenna. Connected by another vehicle area network are the Interior DMS, the ASA Controller, and the DVR. The ASA controller is then connected to the PA System and Ambient Noise Control Microphone. The DVR is connected to internal and external cameras. Coming from the bottom of the MDT rectangle is a red line representing an Ethernet link. This link connects a Wireless Mobile Router/Gateway with cellular modem and WLAN card. This link continues and also connect to the DVR. To the left, the MDT is also connected to the following: Collision Avoidance, Odometer, Covert Alarm Switch, Doors, and Wheelchair.)
Author Notes for Slide 7:
This graphic shows an example of the relationships among various transit ITS technologies onboard a vehicle.
Image Source: Graphic courtesy TranSystems Corporation
Slide 8: Fleet Operations and Management
Communications Technologies
- Depend on infrastructure and devices used to transmit voice and data
- Can transmit voice, text, data, and video over radio, cellular, or other wireless networks
- Types of wireless networks:
- Wide area wireless (WAW)
- Wireless local area network (WLAN)
- Dedicated short-range communications (DSRC)
- Land line and cellular telephone networks
- Internet and intranet
Author Notes for Slide 8:
Communication technologies:
- Critical to the integration and implementation of specific transit technology applications, such as AVL and en-route/wayside traveler information
- Provide critical links among drivers, dispatchers, emergency response, customers, and other personnel involved in transit
- Range from voice radio to comprehensive systems that combine various communication technologies to allow interaction among a wide range of communication and data systems
Voice, text, data, and video can be transmitted over radio, cellular, or other wireless networks. Emerging technologies include Wi-Fi mesh networks, Wi-Max, and connected vehicle communications.
Wireless communication systems include the following:
- Wide area wireless (WAW) - based on radio frequency broadcasting
- Wireless local area networks (WLANs) - data communication systems (analogous to a wireless Internet connection) that allow transit vehicles to communicate with a base station or vice versa
- Dedicated short-range communications (DSRC) - a beacon/tag combination used in transit signal priority (TSP) systems and toll collection
- Land line and cellular telephone networks
- Internet and intranet
Image Source: Photograph courtesy of Carol Schweiger, Schweiger Consulting
Slide 9: Fleet Operations and Management
Automatic Vehicle Location (AVL) and Computer-aided Dispatch (CAD)
- For operations management-periodically receives real-time updates on vehicle locations and schedule/route status
- Onboard computer with Global Positioning System and mobile data communications
- Provides decisions support tools used by dispatchers and supervisors, allowing proactive management of operations
- Allows for "single point" logon for all onboard systems
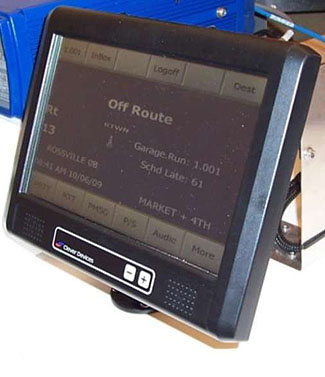
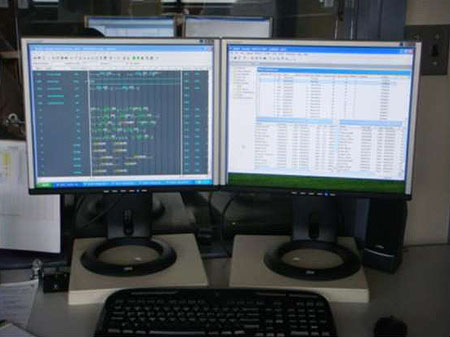
Author Notes for Slide 9:
An AVL system:
- Is defined as central software used by dispatchers for operations management that periodically receives real-time updates on fleet vehicle locations
- Typically involves an onboard computer (called mobile data terminal [MDT] or mobile data computer [MDC]) with an integrated Global Positioning System (GPS) receiver and mobile data communications capability
- Allows transit managers to monitor the actual or approximate location of transit vehicles in their fleet at any given time
Computer-aided Dispatch (CAD) software provides decisions support tools used by transit dispatchers and supervisors to monitor operations in real-time, allowing them to manage the operations proactively (handling delays, disruptions in service, and incidents as they occur). By having the CAD system notify operations staff of problems by exception, it allows staff to focus on areas of concern without the need to personally monitor operations to identify issues.
CAD can facilitate the "adjustment of vehicle headways, dispatching replacement or additional vehicles, or reporting incidences." The key transit technologies that work hand-in-hand with CAD are AVL and communication technologies. Most agencies refer to CAD and AVL as a combined CAD/AVL system.
Image Sources: Photographs courtesy of TranSystems Corporation
Slide 10: Fleet Operations and Management
Automatic Passenger Counters (APCs)
- Monitors passenger activity and uses algorithm to count number of boarding and alighting passengers
- Data can either be stored for downloading/uploading or transmitted in real-time
- Most common types are treadle mats and infrared technology
- Ability to "stamp" data with exact bus stop location and time of day through integration with AVL
Author Notes for Slide 10:
Automatic Passenger Counters (APCs):
- Technologies that are used to count the number of passengers boarding and alighting a transit vehicle
- Includes microprocessor that monitors the passenger activity and uses an algorithm to determine when a passenger has entered or exited a vehicle
- Generates data that can either be stored for downloading/uploading or can be transmitted via radio. Downloading/uploading can be done by one of several methods, including infrared transfer over an agency's wireless local area network (WLAN) in or near an agency garage
- Can accurately "stamp" the data with the exact bus stop location and time of day. This is most commonly done by integrating the APC with the AVL system
- Can monitor odometer readings and door switch signals to identify when a bus stop occurs
There are several types of APC technology. Two of these are the most common— treadle mats and infrared technology. The latter method uses infrared beams to make the passenger counts. Infrared devices can be mounted either overhead or on the side.
Real-time information from APC systems can be used for conditional TSP based on the number passengers onboard at a given time.
Slide 11: Fleet Operations and Management
APCs (continued)
- Real-time information used for conditional TSP
- Can reduce cost of manual data collection and National Transit Database reporting requirements
- Transit operators typically deploy APC equipment on 12-25% of their vehicles and then rotate the vehicles on different routes as needed
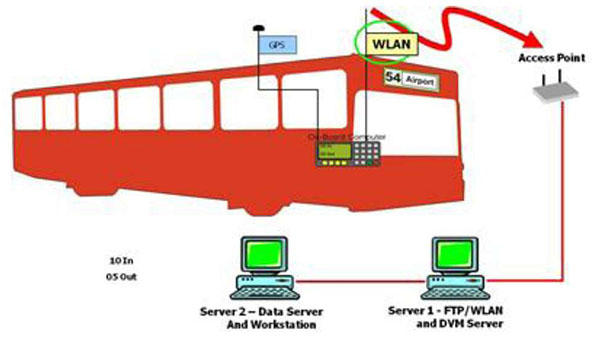
(Extended Text Description: This image shows the red silhouette of a transit vehicle with various signal and computer connections. An icon of an electronic device is placed on the vehicle and labeled "On-Board Computer." A dark gray line connects the device to a GPS. Another dark gray line extends directly above the computer and above the vehicle. On this line is a yellow tag labeled WLAN. From the top of that line, is a curvy red arrow pointing to a small rectangular device labeled "Access Point." From the access point, there is a dark red line that goes through a computer icon labeled "Server 1 – FTP/WLAN and DVM Server" and onto a second computer icon labeled "Server 2 – Data Server and Workstation." To the left of the computers text reads "10 In 05 Out.")
Author Notes for Slide 11:
APC systems are often implemented to reduce the cost of manual data collection and National Transit Database reporting requirements. The data can also be used for route scheduling by, for example, identifying the maximum load point, loading profiles and optimizing locations for short-turn patterns. Transit operators typically deploy APC equipment on 12-25% of their vehicles and then rotate the vehicles on different routes as needed.
Image Source: Graphic permission of INIT, Inc.
Slide 12: Fleet Operations and Management
Scheduling Software
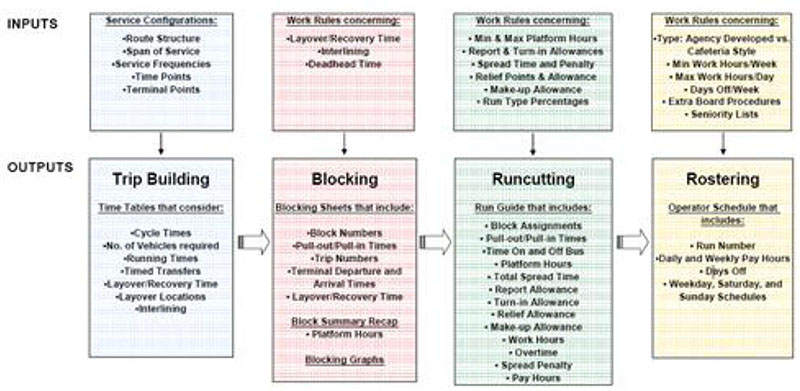
(Extended Text Description: This slide shows the scheduling process for fixed-route transit service. The top row of the diagram represents Inputs, the bottom row represents Outputs. Beginning at the top left, a blue rectangle labeled "Service Configurations" lists the following inputs: Route Structure, Span of Service, Service Frequencies, Time Points, and Terminal Points. An arrow points to an output box labeled "Trip Building" with an output of "Time Tables that consider: Cycle Times, No. of Vehicles required, Running Times, Timed Transfers, Layover Recovery Time, Layover Locations, and Interlining." From the "Trip Building" box, an arrow points to a red box labeled "Blocking." Inputs required for "Blocking" appear in a red box above, and include the following work rules concerning: Layover/Recovery Time, Interlining, and Deadhead Time. The "Blocking" outputs listed in the bottom rectangle are "Blocking Sheets that include: Block Numbers, Pull-out/Pull-in Times, Trip Numbers, Terminal Departure and Arrival Times, and Layover/Recovery Time." Also listed is "Block Summary Recap" with "Platform Hours" listed underneath, and "Blocking Graphs." From the "Blocking" box, an arrow points to a box labeled "Runcutting." The inputs in the box above this area address the need for "Work Rules concerning: Min & Max Platform Hours, Report & Turn in Allowances, Spread Time and Penalty, Relief Points & Allowance, Make-up Allowance, and Run Type Percentages". The output listed in the "Runcutting" box below is a "Run Guide that includes: Block Assignments, Pull-out/Pull-in times, Time On and Off Bus, Platform Hours, Total Spread Time, Report Allowance, Turn-in Allowance, Relief Allowance, Make-up allowance, Work Hours, Overtime, Spread Penalty, and Pay Hours." From the "Runcutting" box an arrow points to a yellow box labeled "Rostering." The inputs for "Rostering" that are noted above include work rules concerning the following: Type – Agency Developed vs. Cafeteria Style, Min Work Hours/week, Max Work Hours/ Day, Days Off/Week, Extra Board Procedures, Seniority Lists. The "Rostering" output noted in the lower box includes an Operator Schedule that addresses: Run number, Daily and Weekly Pay Hours, Days Off, Weekdays, Saturday, and Sunday Schedules. )
Author Notes for Slide 12:
This slide shows the scheduling process for fixed-route transit service. Scheduling transit services involves activities including trip building, blocking, runcutting, and rostering. The scheduling process is different for fixed-route and paratransit services. For fixed-route services, scheduling software provides a "tool that provides the scheduler with greater flexibility, functionality, and control over scheduling their services. It also works to reduces mistakes, improve vehicle and operator efficiencies, reduce staff time on tedious activities, and provide better reporting capabilities."
Quote source: Mark Mistretta, "Fixed Route Transit Scheduling in Florida: The State of the Industry," March 2005, prepared for Florida Department of Transportation, page 35.
Image Source: Mark Mistretta, "Fixed Route Transit Scheduling in Florida: The State of the Industry," March 2005, prepared for Florida Department of Transportation, page 3.
Slide 13: Fleet Operations and Management
Transfer Connection Protection (TCP)
- Triggered when vehicle operator of incoming vehicle makes a transfer request using a mobile data terminal (MDT) to enter outgoing route
- Central system determines whether outgoing vehicle can and should be held based on estimated arrival time of incoming vehicle
- Central system will notify:
- Incoming vehicle's operator whether outgoing vehicle will be held
- Outgoing vehicle's operator if it is to hold, until what time, and for what route
- Dispatcher reviews current pending transfers
Author Notes for Slide 13:
TCP uses two other technologies mentioned earlier. An MDT operates in conjunction with a CAD/AVL system to provide TCP. TCP is triggered when the vehicle operator of an incoming vehicle makes a transfer request. The incoming vehicle's operator shall be able to use the MDT to enter the outgoing route, by selecting from a predefined list. The central system will determine whether the outgoing vehicle can and should be held without any need for dispatcher intervention based on the estimated arrival time of the incoming vehicle. The central system will notify the incoming vehicle's operator via the MDT whether the outgoing vehicle will be held. The central system will also notify the outgoing vehicle's operator via the MDT if it is to hold, until what time, and for what route. The dispatcher is able to review current pending transfers, including the incoming and outgoing vehicles involved, and the time the incoming vehicle is expected to arrive at the transfer.
TCP is one of the three applications in the Integrated Dynamic Transit Operations (IDTO) bundle within the USDOT Connected Vehicle Program. T-CONNECT is a concept that is intended to improve the probability of automatic intermodal transfer connections for travelers who utilize more than one mode for their trips. Travelers will have the ability to request a transfer using their personal devices or onboard transit vehicles (with assistance from drivers or using agency-equipped onboard interactive devices). Based on the system configuration (system schedule, schedule adherence status and delay thresholds, and service variability), connection protection rules, and traveler requests, the system will automatically determine the feasibility of a requested transfer. When a transfer request can be met, the system will automatically notify the traveler and the driver of the vehicle to which the traveler intended to transfer.
Slide 14: Fleet Operations and Management
Transit Signal Priority (TSP)
- Give authorized transit vehicles ability to automatically change the timing of traffic signals
- Can be limited to extending green cycle, but can result in red cycle truncation and phase insertion
- May be done "conditionally" based on passenger load, type of service (Bus Rapid Transit (BRT) vs. local), and schedule adherence
Author Notes for Slide 14:
Transit Signal Priority (TSP) systems are shown on the slide. The goal of these systems is to give priority to transit, and priority or preemption to emergency vehicles by reducing wait time at traffic signals without having an adverse impact on traffic. (Sometimes, preempting signals for emergency vehicles can have an adverse effect on traffic.)
Communication between the bus and the signal controller can be via radio frequency (as in DSRC), infrared, sonic, Wi-Fi mesh network, or cellular network.
With transit applications:
- Some traffic signal controllers use information communicated from the vehicles concerning their on-time status, indicating that the only vehicles that are running a prescribed amount of time behind schedule would be granted priority
- Limits disruption to normal signal timing patterns and progression sequences with other coordinated signals on a roadway
Slide 15: Fleet Operations and Management
Transit Signal Priority (continued)
- Interaction of four major elements:
- Transit vehicle
- Transit fleet management
- Traffic control
- Traffic control management
- Enhanced with four functional applications of vehicle detection, priority request generation (PRG), priority request server (PRS), and TSP control
Author Notes for Slide 15:
TSP systems involve the interaction of four major elements:
- The transit vehicle
- Transit fleet management
- Traffic control
- Traffic control management
These four subsystems are then enhanced with four functional applications:
- Detection - A system to deliver vehicle data, (location, arrival time, approach, etc.) to a device that is routed to a Priority Request Generator;
- Priority Request Generator/Server - A system to request priority from the traffic control system and triage multiple requests as necessary;
- Priority Control Strategies - A traffic control system software enhancement that provides a range [of] "TSP Control Strategies" that address the functional requirements of the traffic jurisdiction; and
- TSP System Management - Incorporates both traffic and transit TSP functions in both transit management and traffic control management that can configure settings, log events and provide reporting capabilities.
Slide 16: Fleet Operations and Management
Yard Management
- Automatically locates vehicles within certain distance accuracy inside yard
- Allows yard attendants to adjust vehicle locations manually on a yard map
- Provides interface with CAD/AVL system to record pull-in and pull-out time, and assigned vehicle operators
- Can be interfaced with fixed-route scheduling software to access vehicle operator information in real-time
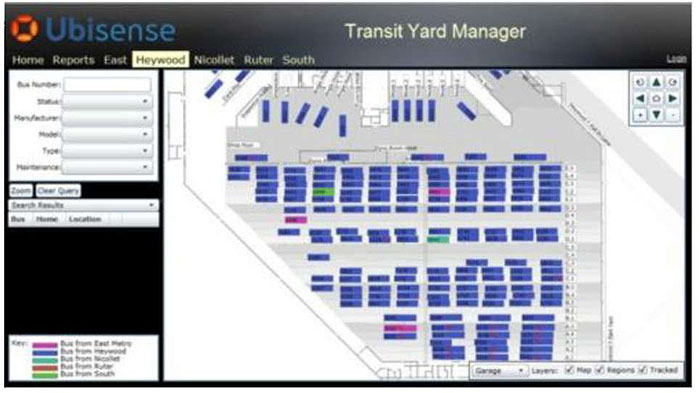
(Extended Text Description: This is an example of a Transit Yard Manager interface from Ubisense. At the top of the display next to the Ubisense logo, the image is labeled Transit Yard Manager. Below the logo, is the interface navigation bar with the following selections: Home Reports, East, Heywood which is highlighted, Nicollet, Ruter, and South. Along the side is a query box. Selections included in the query box are Bus Number, Status, Manufacturer, Model, Type, and Maintenance. Search results appear below the query box. In the main screen is a map of the transit yard. Vehicles are color coded per route. In the upper right is a directional navigation tool. )
Author Notes for Slide 16:
Yard management:
- Helps to manage fixed-route vehicles when they are located in the yard
- Provides visual display of the location of vehicles on a digitized map of the yard layout
- Automatically locates fixed-route vehicles within a certain distance inside the yard
- Allows yard attendants to adjust vehicle locations manually on a yard map, if necessary
- Can provide an interface with a CAD/AVL system to record pull-in and pull-out time, and assigned vehicle operators
- Can be interfaced with fixed-route scheduling software to access vehicle operator information in real-time
- Can alert a transit system to a vehicle that did not return to its designated location (e.g., garage, parking lot) at the end of the service day or that is not at the location but should be
- Can identify a bus that should not be at a particular location but is there, which could be the situation when a driver never pulled out to begin service
The technology used for locating vehicles within the yard can be done in one of a variety of methods (e.g., triangulation using wireless routers).
Image Source: Graphic from https://www.ubisense.net/en/media/pdfs/factsheets_pdf/32938_tym_fact_sheet.pdf- content is no longer available.
Slide 17: Fleet Operations and Management
Intelligent Vehicle Technologies
- Rear Impact Collision Warning System
- Side Collision Warning/Object Detection System (aka Lane Change and Merge Collision Avoidance)
- Frontal Collision Warning System
- Intersection Conflict Warning System
- Lane Change/Merge Warning System
- Pedestrian Collision Warning
Author Notes for Slide 17:
Intelligent vehicle technologies:
- Reduce the probability of vehicle accidents through the use of vehicle controls and driver warnings
- Help drivers process information, make better decisions, and operate their vehicles more effectively
One of these areas is collision avoidance systems (CAS), which range from providing a warning to more intrusive—taking control of the vehicle. In terms of safety, fewer accidents translate to big savings in legal fees and lawsuits. In terms of operations, fewer collisions mean that a larger portion of the fleet is in running condition. Further, with a greater portion of the fleet in running condition, the transit agency can lower its spare ratio making it possible to put more buses on existing or new routes.
CAS include those listed on this slide.
Slide 18: Fleet Operations and Management
Intelligent Vehicle Technologies (continued)
- Vehicle Assist and Automation (VAA):
- Lateral Guidance (aka lane keeping for operating on narrow rights-of-way, such as freeway shoulders)
- Vehicle Platooning
- Precision Docking
- Automated Operations
Author Notes for Slide 18:
Vehicle Assist and Automation (VAA) for transit operations assists or automates movement of buses to allow precise operations in extremely narrow lanes, at stations, and potentially bus maintenance facilities. This category of intelligent vehicle technologies includes the following:
- Precision Docking, which allows vehicle's doors to line up precisely with the edge of the station platform
- Vehicle Guidance, which controls the lateral movement of the bus while the operator controls the speed of forward motion
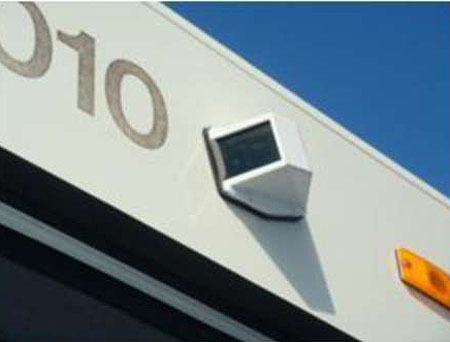
- Vehicle Platooning, which provides vehicle-to-vehicle communications to allow vehicles to follow each other at close distances
- Automated Operations, which is fully automated driving where both longitudinal and lateral control may be safely turned over to the onboard system
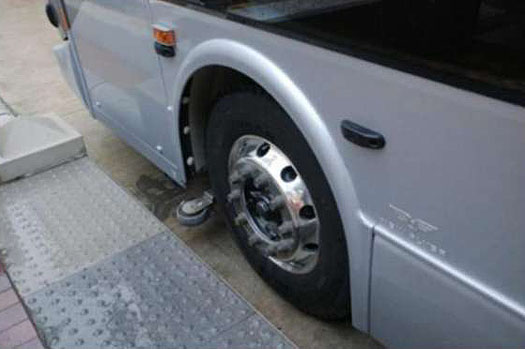
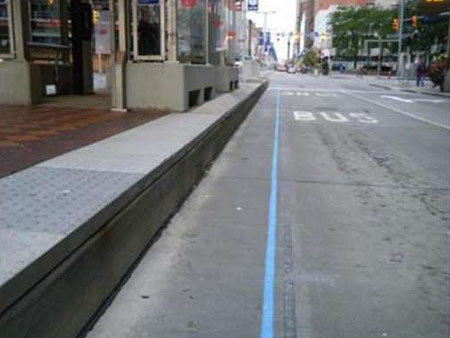
The Greater Cleveland Regional Transit Authority in Cleveland, Ohio, operates a bus rapid transit (BRT) services called the HealthLine. The HealthLine vehicles use three tools for precision docking:
- Primary one being the mechanical guide wheel/docking arm shown in the left photo
- A painted blue guide stripe on the pavement and a docking assist system. The blue guide stripe, shown in the other photo, helps the driver to align the vehicle as he/she approaches the station
- Docking assist system (DAS) consists of two ultrasonic sensors, one system controller and an audible warning device. As the driver approaches the station, the DAS will emit four successive beeps when contact with the platform is imminent. It is important to note that the painted guide stripe and DAS are not required for proper operation of the mechanical guide wheel. They were added as an extra assist to the guide wheel.
Image Source: Graphic from https://www.nbrti.org/docs/pdf/Cleveland_Mechanical_Guide_Wheel_Evaluation_508%20Format.pdf- content is no longer available.
Slide 19: Fleet Operations and Management
Lane Control Technologies
- Bus shoulder riding
- Intermittent bus lane (IBL)/moving bus lane (MBL)
- Restricted lane for short time intended to be activated only when flow of general traffic is operating below speed that inhibits bus transit speeds
- When traffic conditions not expected to cause delays to bus, intermittent bus lanes not activated
- AVL required to establish bus location, ties into variable message signs (VMS) to inform drivers of lane restriction, and integration into real-time ITS traffic monitoring systems
Author Notes for Slide 19:
These technologies include bus shoulder riding, intermittent bus lane (IBL), and moving bus lane (MBL). IBL/MBL "is a restricted lane for the short time that the bus uses that particular lane." IBL can also be called a moving bus lane. This concept consists of using a general-purpose lane that can be changed to a bus-only lane just for the duration of time needed for the bus to pass. Afterward, the lane reverts back to a general-purpose lane until another approaching bus needs the lane for its movement.
The IBL system is intended to be activated only when the flow of general traffic is operating below a speed that inhibits bus transit speeds. When that threshold is reached—as sensed by technologies that can provide knowledge of real-time traffic conditions—longitudinal flashing lights embedded in the roadway lane divider are activated to warn general-purpose drivers that they cannot enter that lane and that a bus is approaching. Vehicles already in the lane are allowed to continue on. This leaves a moving gap or a moving time window for the bus to travel through. This moving gap can be best described as a zone measured from the back of the bus bumper to a fixed distance ahead of the bus.
Bus speeds and reliability are improved whenever the bus is able to flow independently from the general traffic, but it can be cost-prohibitive to build exclusive bus lanes for routes that are lower in frequency. IBL does not require expensive capital costs because it uses the existing roadway infrastructure and takes only the time it needs to move separately from general traffic. This allows the bus lane to be used for general traffic the majority of time.
Slide 20: Traveler Information
Automatic Voice Announcements (AVA)
- Audio and visual announcements to onboard riders and those waiting to board
- As fixed-route vehicle approaches a stop or other designated location:
- Digitally recorded announcement automatically made over onboard public address system speakers
- Displayed on dynamic message signs inside vehicle to inform passengers about upcoming stops, major intersections
- Can make time-based, location-based, and vehicle operator-initiated announcements/displays
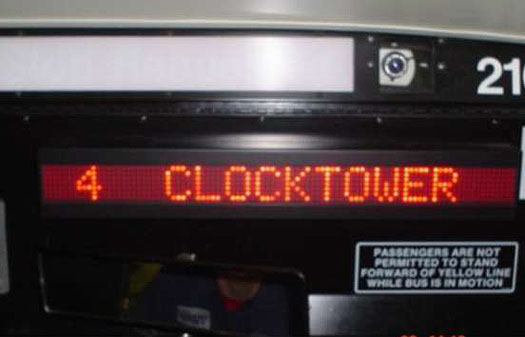
Author Notes for Slide 20:
An AVA system:
- Provides audio and visual announcements to onboard riders and those waiting to board
- Functions as follows: each fixed-route vehicle approaches a stop or other designated location, a digitally recorded announcement is automatically made over the onboard public address (PA) system speakers and displayed on dynamic message signs (DMS) inside the vehicle to inform passengers about upcoming stops, major intersections, and landmarks
- Typically has the capability of making time-based, location-based, and vehicle operator-initiated announcements/displays
- Can make an exterior announcement of the current route number and destination when doors open at a stop
- Is interfaced with AVL systems to ensure that next-stop announcements are made at the appropriate location
- Includes integrating bus destination signs with AVL systems to ensure that destination information display for waiting passengers is accurate. This integration takes the responsibility away from the vehicle operator by automating destination sign changes with the AVL/CAD system.
- Can include "bus is turning" external announcements at specific geographical locations to alert pedestrians and reduce collisions. LYNX in Orlando has tested the system on its LYMMO BRT lanes.
One of the major reasons for the deployment of AVA systems is to comply with the applicable provisions of the Americans with Disabilities Act (ADA) of 1990 as well as providing basic vehicle location awareness and en-route traveler information to riders.
Image Source: Photograph courtesy of TranSystems Corporation
Slide 21: Traveler Information
En-route/Wayside Traveler Information
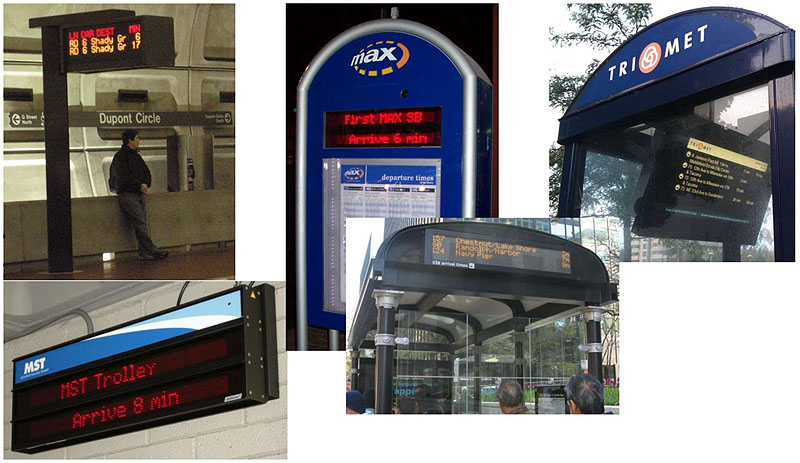
(Extended Text Description: A series of photographs. Top left: This photo shows a man waiting at the Metro Station in Dupont Circle. Mounted on a post to the left of the man is an electronic sign that provides the estimated times of arrival for approaching trains. Lower left: This is an electronic sign mounted on a wall at a Monterey/Salinas Transit stop. The sign is made up of two message panels. The top panel reads "MST Trolley." The bottom panel reads "Arrive 8 min." Center: These three images are other examples of En-route and Wayside Traveler Information displays. The top image shows a blue kiosk with a built in message display. On the kiosk is a list of departure times. The message board reads "First MAX SB Arrive 6 min." The lower image shows an electronic display installed at the top of a transit stop. The sign provides route, destination, and estimated times of arrival information. The top right image shows and large electronic display mounted inside an outdoor transit kiosk. For additional relevant information regarding the images, please see the Author Notes below.)
Author Notes for Slide 21:
This slide shows a variety of different signs from all over the country that are placed en-route/wayside to provide real-time information regarding the status of the next vehicle(s) arriving at a particular stop or station. Providing improved transit traveler information has advanced significantly over the past 20 years with the advent of new technologies, such as AVL and advanced communications, and of new dissemination mechanisms and media, such as mobile telephones and smartphones. Today, transit travelers, particularly choice riders, expect to have comprehensive information about multiple modes (including traffic information) available to them quickly, in one place or from one source, on a variety of media (including electronic signage) and at any point during their trip. Transit agencies are being challenged to meet these travelers' needs, given declining budgets, and the continuing need to provide efficient service. Paper schedules, manually operated customer information telephone services, and the need for travelers to make several telephone calls to obtain information no longer satisfy travelers. Furthermore, transit agencies are exploring new ways to maintain existing riders and to attract new riders. Providing static and real-time transit information using new strategies is a priority in many transit agencies around the world. These strategies include the use of en-route/wayside technologies such as the mobile Internet, dynamic message signs (DMS) as shown in these photos, and wireless mobile devices.
Image Source: Photos courtesy of Carol Schweiger, Schweiger Consulting, and TranSystems Corporation
Slide 22: Traveler Information
Onboard Internet Access
- Being provided particularly on vehicles that service lengthy routes
- Some agencies leveraged onboard communications hardware that provides both data communication for the agency and Wi-Fi for passengers
Author Notes for Slide 22:
Onboard Internet access is being provided by some transit agencies, particularly on vehicles that service routes that are lengthy. Some agencies have leveraged onboard communications hardware that provides both data communication for the agency and Wi-Fi for passengers. The CARTA [Evolution-Data Optimized] EVDO network, deployed in 2007, was needed to support data communications between CARTA vehicles and CARTA headquarters. While designing this network, CARTA noted that it could purchase EVDO modems for vehicles with a built-in router and Wi-Fi. This allowed the agency to provide wireless Internet service to passengers at essentially no cost over the cost of the required data communications network. And, the benefit to passengers—free Internet service—was easily observable.
Audience Interaction: Instructor should ask participants if Wi-Fi would be appropriate on any of their routes. A discussion could ensue regarding the need for Wi-Fi given the fact that some transit customers use smartphones.
Slide 23: Traveler Information
511, 311, and 211 Systems
- On July 21, 2000, Federal Communications Commission (FCC) assigned 511 as nationwide telephone number for traveler information - provided statewide and/or regionally
- FCC designated 211 to be used for locally/regionally operated "community information and referral services" phone systems
- FCC designated 311 to be used for locally/regionally operated, staffed (live operator) phone systems for "nonemergency policy and other government services" information
Author Notes for Slide 23:
511 is being deployed around the country by state and local agencies to provide statewide and/or regional traveler information. While the primary focus of 511 deployment has been on providing traffic conditions, transit information has been provided by many of the current and planned 511 deployments.
The FCC designated 211 to be used for the locally/regionally operated "community information and referral services" phone systems. The FCC designated 311 to be used for locally/regionally operated, staffed (live operator) phone systems for "non-emergency policy and other government services" information.
Non-emergency 311 Service is a local service that allows telephone customers to reach non-emergency local government services. 311 service is optional and may be purchased by a local municipality, a council of governments, a communication district, another state or local governmental unit, or an authorized agent of one or more municipalities or other state or local governmental units to whom authority has been lawfully delegated.
Audience Interaction: Before describing the slide contents, the instructor should ask how many participants know what 211, 311, or 511 is. After describing the slide, the instructor should ask if participants' agencies are integrated with 211, 311, or 511.
Slide 24: Traveler Information
Google Transit
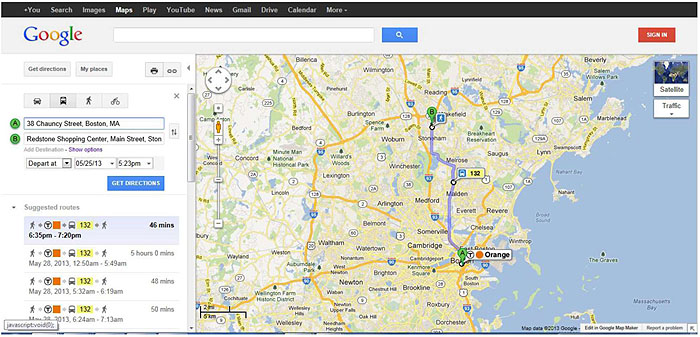
(Extended Text Description: This is a sample screen shot from Google Transit and has the Google navigation menu, Google logo, search box and sign in button at the top. On the main part of the image is a map of the greater Boston area. On the map, pin A represents the starting point on 28 Chauncy Street in Boston. Pin B represents the final destination of Redstone Shopping Center. A purple line traces the route from Chauncy Street to the Redstone Shopping Center. On the left side of the screen shot is the search function. Above it are four icons: car, bus, man walking, and bicycle. Below the search function is a list of suggested routes. The walking route options shown in the image include walking, T and bus routes. For additional relevant information on this slide, please see the Author Notes below.)
Author Notes for Slide 24:
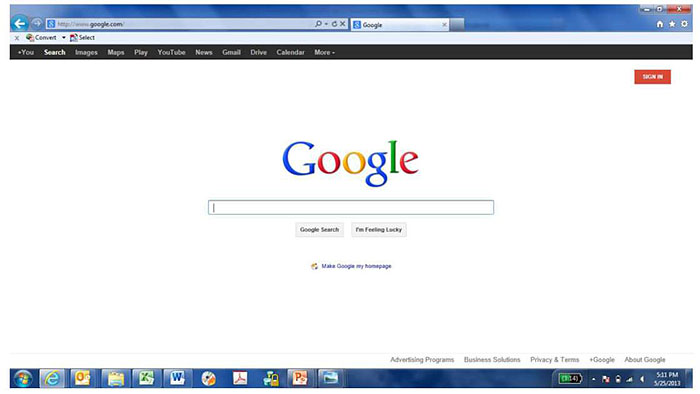
Google Transit is a web-based application that imports agency data in specific file formats (General Transit Feed Specification [GTFS] or GTFS-realtime) to provide a portal for transit trip planning by the general public using Google Maps. The key features of Google Transit are as follows:
- Regional trip planning tools can be developed by coordinating with different agencies in a region that use scheduling software from various vendors
- Origin and destination locations can be selected on a map based interface
- Google Maps features (e.g., street view, hybrid view, satellite view) are available which can be helpful to riders
- Google point-of-interest (POI) search around a stop location is available
- Walk directions are available with turn-by-turn guidance
- Riders can use Google Transit and Google Directions on the same portal to get information on trips that require both options (e.g., park and ride trips). As of now, both applications are not directly linked though.
Bing Maps also include transit routing and real-time information using GTFS.
Audience Interaction: Instructor asks participants if they have experience with either Google Transit or transit information via Bing Maps. For agency representatives, instructor asks if their agency is on Google Transit or Bing Maps.
Image Source: Map data ©2013 Google
Slide 25: Traveler Information
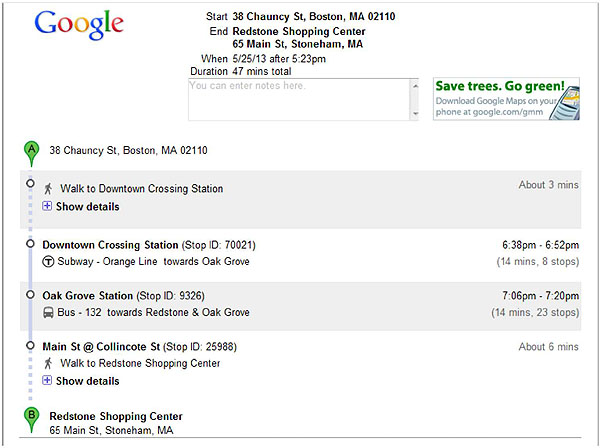
(Extended Text Description: This slide is a sample screen shot of a Google directions search. At the top of the image is the Google logo and the start destination of 38 Chauncy St. Boston, MA 02110 and the end destination "Redstone Shopping Center, 65 Main St., Stoneham, MA" along with the date 5/25/13, time 5:23pm, and the duration time of 47 minutes. The walking search results include the following: Icon of walking person followed by "Walk to Downtown Crossing- About 3 minutes." Next instructions include, "Downtown Crossing Station (Stop ID: 70021), an icon for the T is to the left of descriptor Subway – Orange Line towards Oak Grove - 6:38PM – 6:52pm (14 min., 8 stops)." Next walking directions includes Oak Grove Station (Stop ID 9326). A bus icon appears next to descriptor 132 towards "Redstone & Oak Grove - 7:06PM – 7:20PM (14 min., 23 stops)." The final step is "Main St. @ Collincote St. (Stop ID: 25988)." A walking person icon appears next to the descriptor Walk to Redstone Shopping Center – About 6 minutes. At the very bottom of the screen shot is a B in a green bubble that says Redstone Shopping Center 65 Main St. Stoneham, MA.)
Author Notes for Slide 25:
This slide shows results from a Google directions search using transit.
Image Source: Map data ©2013 Google
Slide 26: Traveler Information
Third-Party Smartphone Applications
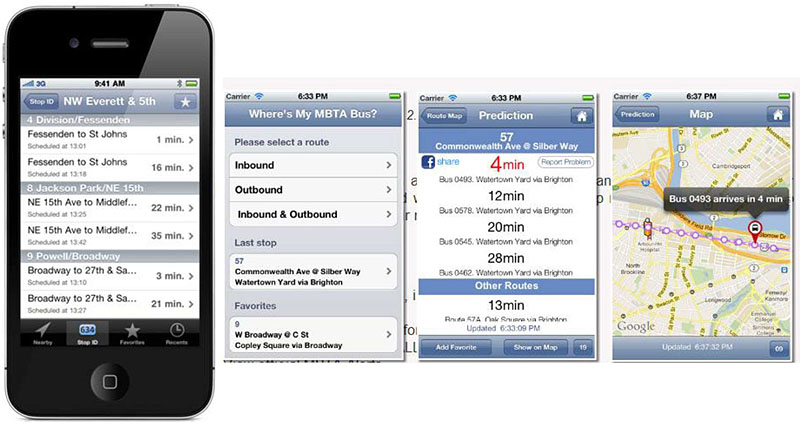
(Extended Text Description: A series of example images of smart phone screen shots. Left: Screen shot of an iPhone directions application with NW Everett & 5th at the top, with different addresses and direction options underneath: 4 Division/Fessenden - Fessenden to St. John's, 1 min >, Fessenden to St. John's, 16 min >; 8 Jackson Park/NE 15th - NE 15th Ave to Middelf..., 22 min >, NE 15th Ave to Middlef..., 35 min >; 9 Powell/Broadway - Broadway to 27th & Sa..., 3 min >, Broadway to 27th & Sa..., 21 min >. Middle left: Another smart phone screen shot with "Where's My MBTA Bus? across the top, and Please select a route underneath with the following options: Inbound, Outbound, Inbound & Outbound. The screen also shows a section Last Stop with 57 Commonwealth Ave @ Saber Way, Watertown Yard via Brighton, and then a section Favorites with 9 W Broadway @ C St, Copley Square via Broadway. Middle Right: Another screen shot of smart phone. Prediction at the top, the address 57 Commonwealth Ave @ Silber Way underneath, with options 4 min (in red), Bus 0493 Watertown Yard via Brighton; 12 min, Bus 0578 Watertown Yard via Brighton, and a series of other timed options. Right: Another screen shot of a smart phone showing possible bus routes. This image has the word Map at the top, and shows a map diagram with a bus route highlighted in purple with white circles to represent bus stops, and a red circled icon of a bus at one bus stop with a text box "Bus 0493 arrives in 4 min.")
Author Notes for Slide 26:
In a TCRP Synthesis study published in 2011, it was determined that using a third-party to develop real-time applications and provide real-time information on mobile devices is overwhelmingly the approach that transit agencies are taking for a variety of reasons. There are five key elements of this study finding:
- Many agencies have limited IT and other related staff, making it very challenging to develop applications and manage the information dissemination in-house.
- The myriad of mobile devices and operating systems, and the speed with which new devices are being released, create a demanding environment within which to develop applications and keep up with new technology.
- With mobile content being used in other industries, such as entertainment (e.g., television, radio, movies, music), advertising and consumer products, there is a significant body of knowledge available to facilitate the development of useful and innovative mobile applications.
- With the large number of mobile phone and smartphone subscribers, there is a great deal of familiarity with mobile applications that are similar to real-time transit information.
- The open data movement [discussed later in this module] is having a significant effect on agencies providing real-time information on mobile devices.
Many third-party smartphone applications have been developed for transit agencies around the U.S.
Image Sources:
Three mobile apps on right-hand side of slide from http://www.grinmans.com/iphone_apps/where_is_my_mbta_bus/
Mobile app on left from https://arrivaltrackerapp.com- content is no longer available.
Slide 27: Safety and Security
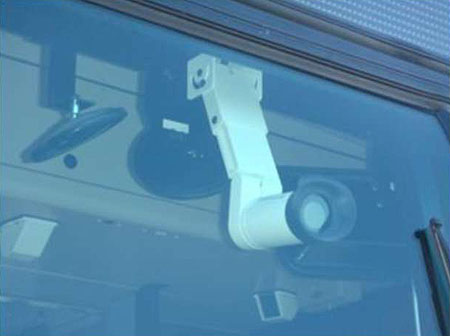
Mobile (onboard and exterior) and Fixed Video Surveillance
- Review recorded images
- Potential crime prevention
- Identify criminal activity and perpetrator(s)
- Identify improper passenger and driver behavior
- Incident/ insurance investigation
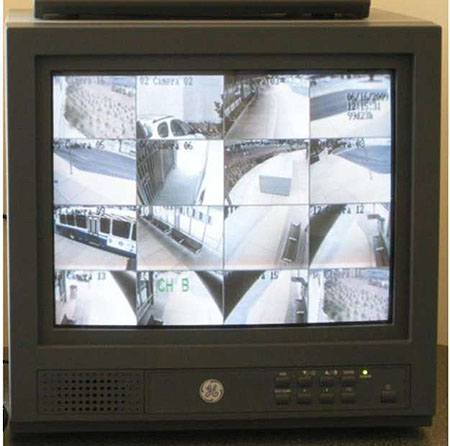
Author Notes for Slide 27:
One of the two most common safety and security systems among transit agencies are onboard (interior) and exterior cameras (a.k.a. onboard video surveillance). Cameras are:
- Gaining popularity as a form of crime deterrence
- Used to review incidents that may have taken place onboard a vehicle in the past
- Play a role in traffic enforcement onboard buses. Cameras are routinely now being used to review driver's traffic violations such as running a red light, not stopping at a stop sign, as well as to review the last few seconds preceding a collision to determine fault.
Some digital video systems allow authorized users to access the systems via Wi-Fi. This allows these users, such as police or transit supervisors, within a certain range of the transit vehicle, to view what is occurring inside the bus by accessing images from video cameras during an incident.
Source: Photos courtesy of Carol Schweiger, Schweiger Consulting, and TranSystems Corporation
Slide 28: Safety and Security
Covert Emergency Alarm and Covert Live Audio Monitoring
- Allows dispatchers to listen in on what is happening inside vehicle while an incident is taking place
- Covert microphones are one-way communications in order not to alert person responsible for incident that dispatcher/police are listening in
- Driver in distress presses a covert switch that activates the covert microphone and monitor in dispatcher's office automatically displays the information for that vehicle and map display zooms in on that vehicle
Author Notes for Slide 28:
Covert microphones and other security technologies are being heavily deployed as part of AVL/CAD systems.
Covert microphone:
- Allows dispatchers to listen in on what is going on inside the vehicle while an incident is taking place
- Is one-way communications in order not to alert the person responsible for the incident that the dispatcher/police are listening in. In some systems, when a driver in distress presses a covert switch that activates the covert microphone, the monitor in the dispatcher's office automatically displays the information for that vehicle and the map display zooms in on the vehicle. All other screens on the dispatcher's computer will not be accessible until the driver cancels the alarm.
Slide 29: Safety and Security
Onboard Digital Video Recorders (DVRs)
- Connected to onboard cameras to record images from cameras
- Equipped with removable recording drive to allow playback of recorded video on centrally located playback system
- Able to store specific number of days of video, beyond which, previously recorded video will be overwritten
- May have capability to use Wi-Fi to upload video once vehicle enters yard or garage
Author Notes for Slide 29:
In addition, DVRs:
- Has several configurable parameters, including frame resolution and frame recording rate
- May have the capability to use Wi-Fi to upload video once the vehicle enters the yard or garage. This allows authorized transit personnel to request video from a specific transit vehicle to review incidents, customer concerns, or for investigations.
Slide 30: Safety and Security
G-Force Monitoring
- System includes g-force sensor and electronic data logger to capture and provide information about unusual movement of transit vehicles and capture events such as vehicle turns, hard braking, and fast acceleration or deceleration
- G-force data can:
- Assist in accident reconstruction and analysis
- Protect transit agencies from litigation
- Reduce cost of insurance
- Analyze operator actions
- Identify maintenance issues
Author Notes for Slide 30:
G-force monitoring:
- Is implemented for two purposes: to provide a collision alert system and monitor driving behavior.
- Can be part of a collision alert system along with an electronic data logger to capture and provide information about the unusual movement of transit vehicles.
- Can warn a vehicle operator about unexpected movements and provide collision warnings to the operator using g-force sensor data.
- In the event of an accident, can store data permanently. These data can be uploaded to a central system.
- Typically, includes an "event tag" button that allows the driver to manually tag accidents, incidents and vehicle fault conditions.
- Often interfaces with an onboard CAD/AVL system to obtain date and time, latitude/longitude, operator ID, vehicle ID, and route ID information to tag g-force sensor information. Further, the data logger can use this interface to log g-force sensor data when the covert alarm is on.
- Can interface with an onboard video surveillance system to log g-force sensor data when the DVR event flag is on.
Slide 31: Automated Fare Payment
Automated fare media
- Magnetic Stripe Cards https://youtu.be/C1l5MxnHR3c - MBTA mTicket
- Smart cards - integrated circuit (or chip) card that has microprocessor and built-in logic: contact, contactless, and combi-card
- Mobile payment - mobile ticketing apps using visual, QR code validation or Near Field Communication (NFC)
- Accommodate options such as stored value, stored trip, various lengths of passes, and capped-trip passes
- Facilitates transfers
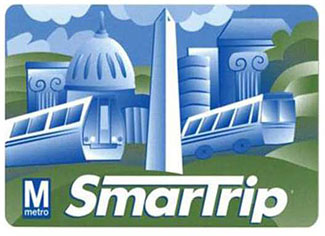
(Extended Text Description: This is an image of the SmarTrip smart card for the Washington DC Metro. This is a rectangular card with blue monochromatic images of the Washington Monument, Capitol building, metro car on the right, a bus on the left, and columns in the background. The DC images are set on an illustration of green hills with blue sky. "SmarTrip" is written in white on the bottom of the cards next to the Washington Metro logo.)
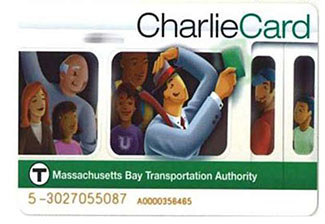
(Extended Text Description: This is a picture of the Massachusetts Bay Transportation Authority CharlieCard for the T system. It is a rectangular card with an illustration of people riding in a subway car, and a man in a blue suit holding up a green item. "CharlieCard" is written in the upper right corner in black and green. A green strip with the T logo and Massachusetts Bay Transportation Authority written in white appear on the lower portion of the card. At the bottom of the card is a serial number.)
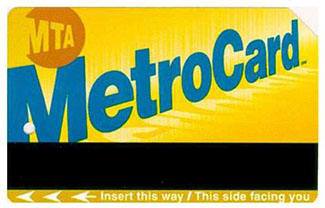
(Extended Text Description: This is an image of the New York City MTA MetroCard. It is a yellow card, with MetroCard printed diagonally across the card in blue. MTA appears off center in an orange circle in the upper left corner of the card. A black strip is on the lower portion of the card. Below the black strip are arrows pointing left with the text "Insert this way/This side facing you.")
Author Notes for Slide 31:
Currently, there are three basic types of electronic fare technologies that have been used for transit purposes:
- Magnetic stripe cards (NYC MTA’s MetroCard shown on this slide)
- Smart cards (WMATA’s SmarTrip card and MBTA’s CharlieCard on this slide). The term smart card refers to an integrated circuit (or chip) card that has a microprocessor and built-in logic. However, the term has come to be used to generally describe a range of automated types of card technologies, including memory cards (without microprocessors) and radio frequency identification (RFID) cards/tags (also often without microprocessors).
- Mobile payment. Transit agencies in the US are implementing quick response (QR) code and Near Field Communication (NFC) mobile platforms for transit payments. Mobile ticketing apps using visual and QR code validation are software-based and relatively easy to deploy. NFC contactless mobile payment implementation is more complex because it requires transit agencies to install open fare payment systems and riders to have NFC-enabled phones.
There are three types of smart cards:
- Contact cards require a physical contact between the card and the read/write unit, and must be inserted into a slot
- Contactless cards (the CharlieCard and SmarTrip cards shown on this slide, respectively) do not have to be inserted into a slot, but rather can be read by passing the card close to the read/write unit. Contactless cards use either a contactless interface to provide power to the card and transfer data using inductive and capacitive techniques, or transfer data between the card and the read/write unit using radio frequency techniques (power is supplied using a battery or by means of received magnetic energy)
- Combi-cards combine the attributes of contact and contactless cards by using either two separate chips or a single chip capable of being accessed in either fashion.
“Increasing numbers of regional US transit operators are seeing the benefits of incorporating mobile technology into their business and payment strategies. Benefits include greater convenience and additional payment options to customers, reduced fare collection costs and increased efficiency. Historically, changes to fare systems require long, complex procurement processes. However, mobile ticketing apps using visual and QR code2 validation are relatively easy to deploy and require limited hardware upgrades and integration into existing systems. Transit agencies in Boston, Dallas, and Portland (Ore.) currently offer mobile ticketing apps for commuter rail, buses, and ferries. A number of transit agencies are in the process of implementing open payments infrastructure that allow riders to choose from several electronic payment options, including near field communication (NFC) contactless mobile payments. Transit agencies in Salt Lake City and Chicago have already installed open fare payment systems.” Elisa Tavilla, Federal Reserve Bank of Boston, “Transit Mobile Payments: Driving Consumer Experience and Adoption,” February 2015, https://www.bostonfed.org/bankinfo/payment-strategies/publications/2015/transit-mobile-payments.pdf, page 3.
This slide includes a video about mTicket, an app for paying for Commuter Rail fares using a smartphone.
Source: Card images courtesy MBTA, MBTA, and WMATA
Slide 32: Automated Fare Payment
Automated Fareboxes and Faregates
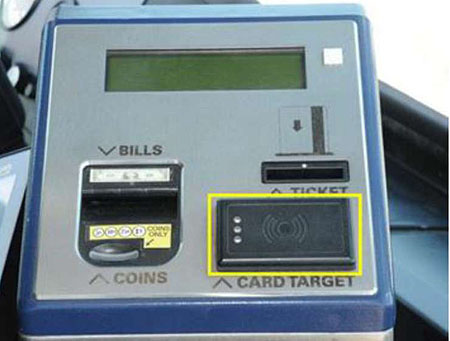
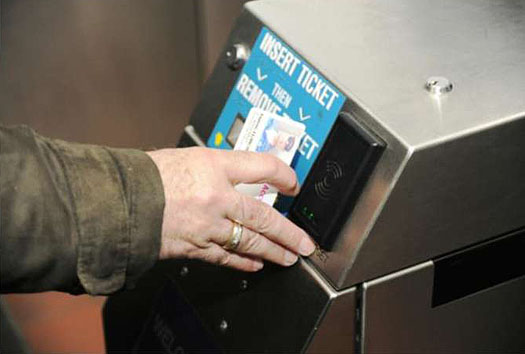
Author Notes for Slide 32:
Automated fareboxes and faregates are integral parts of automated fare collection systems. These are two types of fare collection use fareboxes and faregates, as follows:
- Barrier (i.e., pay on entering and/or exiting a station or loading area). Involves turnstiles, faregates, and ticket agents or some combination of all three; may involve entry control only or entry and exit control, particularly for a distance-based system.
- Pay on boarding (i.e., on entering the vehicle). Typically involves a farebox or a ticket or card processing unit.
A decision on fare payment technology is separate from choosing a basic fare collection approach. However, the type of technology selected can have definite implications on the approach.
- For barrier, pay on boarding and conductor validated systems, the major implication of electronic payment is the need for appropriate equipment (e.g., magnetic/smart card readers and vending/add-value machines for barrier and pay on boarding, hand-held readers for conductor validated)
- Automated faregates or fareboxes identify the validity of the farecard and, for a stored-value card, deduct the proper fare value
- Some state-of-the-art fare collection systems require a communications backbone to provide real-time communications for activities such as credit card verification and equipment status monitoring
Image Sources: Photographs courtesy MBTA
Slide 33: Automated Fare Payment: Ticket Vending Machines
- Types of transactions:
- Accept coins only
- Accept bills and coins
- Accept credit cards
- Accept debit cards
- Make bill change
- Accept tokens
- Accept paper coupons
- Validate vouchers
- Reload smart cards
- Types of fare media issued:
- Single ride
- Round trip
- Day pass
- Monthly pass
- Multiple-day pass
- Multiple-ride pass
- Stored-value fare card
- Reload stored-value fare card
Author Notes for Slide 33:
Ticket vending machines (TVMs) are used by many transit agencies to dispense various types of fare payment media.
Audience Interaction: The instructor will ask participants about their experience with TVMs from an operations and maintenance perspective.
Slide 34: Maintenance
Engine and Drivetrain Systems Monitoring (a.k.a. vehicle component monitoring)
- Sensors that monitor various components of vehicle and report back on components performance
- Maintenance supervisors can use this information to perform preventive maintenance intervention before a minor problem becomes major and costly one
- Monitoring performed in real-time and problems are reported instantly
Author Notes for Slide 34:
- In-vehicle diagnostics system monitors conditions of transit vehicle components, especially the engines, and provides failure warnings
- Out-of-tolerance conditions may be passed on to dispatch in real time using a data connection between the transit vehicle and central control or downloaded during vehicle servicing at the transit garage
- This system includes software that manages the maintenance records of each transit vehicle and parts inventories. This type of system is also known as Vehicle Component Monitoring (VCM), Automatic Vehicle Monitoring, or Maintenance Tracking.
A VCM system is a set of sensors that monitor various components of the vehicle and report back on components performance. Components such as engine, transmission, anti-lock brakes, and various fluid levels are constantly monitored. By keeping track of these components, maintenance supervisors can use this information to perform preventive maintenance intervention before a minor problem becomes a major and costly one. Unlike an APC system—where ridership data is downloaded at the end of the day—vehicle component monitoring is performed in real-time and problems are reported instantly.
In addition to preventing a minor problem from becoming a major and costly one, engine monitoring also allows a transit agency to remove a vehicle from service before a breakdown that interrupts the travel of potentially hundreds of people. A disabled bus that cannot provide service on that one run will cause missed trips, frustration, and, in some cases, causes commuters to miss the start of a work shift.
Slide 35: Data Management and Reporting
- Data generated by public transit ITS components installed in vehicles, at central locations, or at other locations
- Data typically collected and archived in individual databases
- Once data archived, used for "after-the-fact" analyses and reporting by different business units within a public transport organization (e.g., planning, operations, customer service)
- Utilize true potential of data by consolidating in central repository to make process of data management, analysis, and reporting more efficient
Author Notes for Slide 35:
Public transit ITS components installed in vehicles, at central locations (e.g., control centers) or at other locations (e.g., stops and shelters) generate an enormous amount of data that are typically collected and archived in the individual databases of systems that generate the data. The extent of field data collected on board vehicles depends on the configuration of the ITS systems and subsystems on vehicles or at other locations (e.g., refresh rate of automatic vehicle location [AVL] subsystem, recording rate of onboard video surveillance subsystem and health diagnostics refresh rate for offsite equipment). Once the ITS data is archived, it is used for a variety of "after-the-fact" analyses and reporting by different business units within a public transport organization (e.g., planning, operations, customer service).
The maintenance of archived databases for individual systems requires a large amount of agency resources (e.g., staff commitment in terms of hours, physical servers) and can at times be cost-prohibitive. Given the more widespread adoption of technological advances in recent years such as server virtualization and cloud computing, public transport organizations have been trying to utilize the true potential of the ITS data by consolidating data in a central repository to make the process of data management, analysis, and reporting more efficient.
Audience Interaction: The instructor can ask participants if they have any experience with datamarts or data warehousing in transit, and what benefits accrue from these approaches.
Slide 36: Technology Integration
- Opportunities for technologies to be integrated with systems that are external to transit agency, such as a regional traffic management center or an information services provider
- Integration, when implemented from enterprise-wide perspective and regional perspective when appropriate, improves overall usability of technology environment made up of products from different vendors on multiple platforms and data from different systems
- Facilitates "system" of interconnected ITS applications that collectively produce services and advantages far greater than ITS applications could achieve individually and independently
Author Notes for Slide 36:
As discussed at the beginning of this module, many transit ITS technologies are dependent upon each other to function. Further, there are opportunities for technologies to be integrated with systems that are external to a transit agency, such as a regional traffic management center or an information services provider. Thus, integration, when implemented from an enterprise-wide perspective and a regional perspective when appropriate, improves the overall usability of a technology environment made up of products from many different vendors on multiple platforms and data from many different systems. Integration is also valuable to transit ITS in that it facilitates a "system" of interconnected ITS applications that collectively produce services and advantages far greater than the ITS applications could achieve independently.
The importance of integration can be described with the following example:
- Disparate systems, each with its own GPS unit, can lead to conflicting location stamps in systems depending on when each GPS was polled
- This is a minor issue when comparing the AVL location to the location stamp on a digital video recording, but can be a major issue with precision docking or connected vehicle technology
- Different system times, even if they are related to the time zone setting, can cause archived data to show the vehicle in two different locations at the same time
The more systems are integrated and use a single data source, the more that the information will be consistent and synchronized. Also, this is important as transit technology systems are interfaced with non-transit systems.
Slide 37: Geographic Information System (GIS) Application
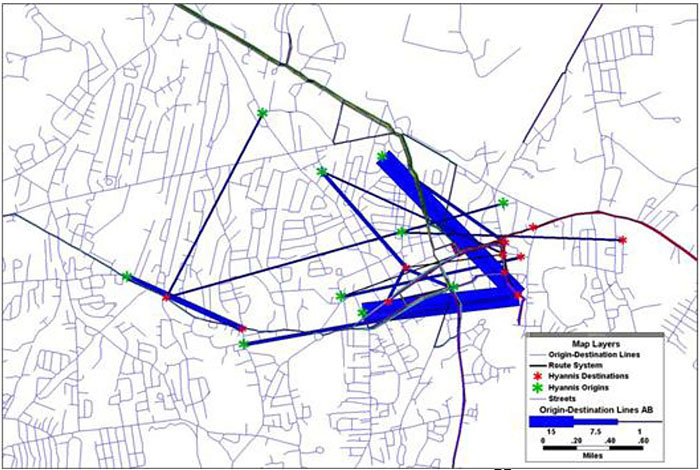
(Extended Text Description: This slide shows the paratransit origins and destinations in Hyannis, MA. This GIS data could be used to justify the creation of one or more fixed routes that cover most of the paratransit origins and destinations. In this image, a roadmap of the Hyannis area is shown. Origin-destination lines appear in light blue. A thin black line represents the Route system. Hyannis destinations are identified with red asterisks. Hyannis origins are marked with green asterisks. Red asterisks are scattered yet more concentrated in the center right of the map. Green asterisks are equally scattered around the map. A dark blue line indicates the number of Origin-Destination Lines AB. Dark blue lines of varying thickness appear connecting various red and green asterisks around the map. The thickest of the blue lines form a "V" shape pointing to a single red asterisk just right of the center of the image. For additional relevant information on the contents of this image, please see the Author Notes below.)
Author Notes for Slide 37:
Geographic Information Systems (GIS):
- Provide database management capabilities for the display and editing of geographically referenced entities and underlying attribute data
- Provides the ability to perform analyses of geographic features such as:
- Point databases (bus stops, communications transmitters, customer facilities)
- Lines (streets, bus routes, subway tracks, rights of way)
- Areas (census tracks, census blocks, traffic analysis zones, zip codes)
- Combines the ability to accurately map geographically referenced data and to create themes such as employment density by traffic analysis zone or mobility limited persons by block group
- Allows transit agencies to analyze the potential effects of adding, removing, or re-routing service
- Is used to support the trip itinerary planning software, flexible routing and scheduling software required in the paratransit industry, and the real-time vehicle location components of operations software
Databases most relevant to transit are streets and highways, operational facilities, layover locations, passenger facilities including multimodal centers, bus stops and shelters, designated transfer points, and major landmarks.
This slide shows paratransit origins and destinations in Hyannis, MA. This GIS data could be used to justify the creation of one or more fixed routes that cover most of the paratransit origins and destinations.
Image Source: Graphic courtesy Multisystems (now TranSystems Corporation)
Slide 38: Service Coordination Facilitated by Technology: Example
- The Lower Savannah Aging, Disability & Transportation Resource Center in Aiken, SC deployed a regional Travel Management and Coordination Center (TMCC) in August 2010
- Established TMCC to handle requests for service from consumers and agencies needing human services information or referral, and regional transportation
- TMCC has visibility and access to all transportation resources to refer, schedule and assign consumers to transportation providers
- Technologies increased coordination among agencies that transport clients and provided more passenger trips in the Lower Savannah region
Author Notes for Slide 38:
The example on this slide is representative of using technology to facilitate service coordination. In August 2010, the Lower Savannah Council of Governments (LSCOG) Travel Management Coordination Center (TMCC) opened, providing transportation, human service information, and referral services to facilitate greater mobility. The major goal of the TMCC was to establish a regional mobility and information center that handles incoming requests for service from consumers and agencies needing human services information or referral, and regional transportation. The TMCC has visibility and access to all transportation resources available for the benefit of referring, scheduling and assigning consumers to transportation providers at the time and date of service requested.
The center's establishment grows out of LSCOG's participation in the USDOT and Federal Transit Administration's (FTA) Mobility Services for All Americans (MSAA) research initiative. The goal of MSAA is developing a regional call center utilizing the latest technologies, which other transportation agencies could use as a blueprint to make transportation more cost efficient for providers and passengers alike, especially passengers facing special challenges, including disabilities, age, or rural barriers.
Slide 39: Service Coordination Facilitated by Technology (continued)
- The foundations of the MSAA program is best described in the following videos:
Author Notes for Slide 39:
These videos explain the Mobility Services for All Americans initiative.
Slide 40: Open Data for Third-party Application Development
- Definition:
- Accessible at no more than cost of reproduction, without limitations based on user identity or intent
- In a digital, machine readable format for interoperation with other data
- Free of restriction on use or redistribution in its licensing conditions
- As of 2014, of 864 U.S. transit agencies, 248 have open data
Author Notes for Slide 40:
Open data is defined as meeting the following criteria:
- Accessible (ideally via the Internet) at no more than the cost of reproduction, without limitations based on user identity or intent;
- In a digital, machine readable format for interoperation with other data; and
- Free of restriction on use or redistribution in its licensing conditions. The process for agencies to provide open data includes the following:
- Exporting their data using the General Transit Feed Specification (GTFS) or GTFS-realtime. GTFS is a widely accepted format for publishing transit data, and allows agencies to be included on Google Transit or Bing Maps
- Once the data is exported, an agency makes it available via either a developer Web site (within the agency Web site) or places the data in another Web site that will host the data feed. Many agencies create a License Agreement or Terms of Use to govern how data can be used by developers
- Finally, agencies need to keep developers aware of changes to schedule data and other pertinent information so third-party applications are providing accurate information.
As of 2014, City-Go-Round reports that of the 1,026 transit agencies they have in their database (864 of those are in the U.S.), 292 have open data (248 in the U.S.). City-Go-Round defines having open data as providing transit data in GTFS format.
Slide 41: Summary
- Transit ITS continues to improve in terms of systems integration and new technologies:
- Mobile payment systems
- Potential to connect travelers, infrastructure, and vehicles to provide the best possible public transportation options was demonstrated as part of Integrated Dynamic Transit Operations (IDTO) portion of the USDOT Connected Vehicle Program
- Various aspects of vendor products have become open and more open systems are being developed
- Many transit agencies are facing technology retirement and replacement
Author Notes for Slide 41:
Transit ITS includes numerous onboard and centralized technologies that are used to improve operations, maintenance, customer service, and customer convenience. As discussed in the individual parts of this module, there are numerous benefits to deploying these technologies, but it is critical that the dependencies among the components are considered when an agency is planning a technology program. A transit ITS strategy should consider a phased implementation so that the baseline technologies are implemented and operate well before adding other technologies. For example, before providing real-time information to the public, it is imperative that the AVL system that generates information that is used to predict real-time arrivals/departures is operating properly and generating accurate information.
Transit ITS continues to improve in terms of systems integration and new technologies:
- While vendor products still tend to be proprietary, various aspects of their products have become open. For example, paratransit scheduling software vendors are incorporating commercially available MDTs (e.g., tablet computers) into their systems.
- There are more open systems being developed. For example, OneBusAway, a mobile application originally developed at the University of Washington, is based on open-source software.
Many transit agencies are facing the retirement and replacement of technologies that have reached the end of their useful life. Thus, agencies are assessing new technologies for deployment.
Slide 42: References
- A Case Study on Applying the Systems Engineering Approach: Best Practices and Lessons Learned from the Chattanooga SmartBus Project
- TCRP Synthesis 73 - AVL Systems for Bus Transit
- Monterey Salinas Transit ITS Augmentation Project - Phase III Evaluation Report
- TCRP Synthesis 77 - Passenger Counting Systems
- Report on Assessment of Relevant Prior and Ongoing Research for the Concept Development and Needs Identification for Integrated Dynamic Transit Operations
- Transit Signal Priority (TSP): A Planning and Implementation Handbook
- TCRP Synthesis 91 - Use and Deployment of Mobile Device Technology for Real-Time Transit Information
Author Notes for Slide 42:
These are some of the many publications and Web site links that can be used to obtain additional information on this module topic.
Slide 43: Questions?
- What technologies are dependent upon AVL?
- What is the primary function of an APC system?
- What dissemination media can be used to provide real-time transit information?
- What technologies increase the safety and security of passengers?
- What are the benefits of open transit data?
Author Notes for Slide 43:
These questions will assist the instructor in assessing a student's understanding of the material presented. The answers are as follows:
- Several technologies are dependent on an AVL system - CAD, APCs, TCP, TSP, lane control technologies, covert emergency alarm, and covert live audio monitoring, G-force monitoring, and service coordination facilitated by technology.
- The primary function of an APC system is to count boardings and alightings.
- Real-time information can be provided via telephone, Internet, SMS (text messaging), dynamic message signs, and smartphone apps.
- Onboard and facility video surveillance, G-force monitoring, and covert microphones can increase the safety and security of passengers (and drivers).
- Open data availability provides the opportunity for third-party application development which can be a cost-effective approach for an agency to provide customers with information.
Return to top ↑