← Back to Module 14
ITS ePrimer Presentation
Module 14: ITS in Emergencies and Disasters
Slide 1:

ITS ePrimer
Module 14: ITS in Emergencies and Disasters
ITS Professional Capacity Building Program
ITS Joint Program Office
U.S. Department of Transportation
Author’s Slide 1 meeting notes below:
This module is entitled ITS in Emergencies and Disasters.
This module will cover:
- Learning Objectives
- Trends impacting transportation
- Operational Resilience
- Emergency Transportation Operations
- Traffic Incident Management
- Strategies for improving response to emergencies and disasters
- And then we will conclude with a Summary and list of further references
- And we will leave some time at the end for Questions
This module is sponsored by the U.S. Department of Transportation’s ITS Professional Capacity Building (PCB) Program. The ITS PCB Program is part of the Research and Innovative Technology Administration’s ITS Joint Program Office.
Thank you for participating and we hope you find this module helpful.
Slide 2:
Instructors
- Christopher Poe, Ph.D., P.E., ITE Fellow
- Director, Product/User Experience, Mixon Hill, Inc.
- 26 years with Texas A&M Transportation Institute (Retired)
- Previous experience
- PB Farradyne
- Adjunct Professor, University of Texas at Arlington (2001-2009)
- Lee Mixon, P.E., ITE Member
- President, Mixon Hill, Inc.
- Chair, SAE Infrastructure Application Task Force
- Previous experience
- National Engineering Technology Corp
- Black & Veatch
- Burns & McDonnell
Author’s Slide 2 meeting notes below:
The Instructors for this module are Christopher Poe and Lee Mixon.
Slide 3:
Module 14: ITS in Emergencies and Disasters
- Module 14 provides basic information on how intelligent transportation system (ITS) can support response to emergencies and disasters. By planning, operating, and training for operational resilience, emergency transportation operations (ETO), and traffic incident management (TIM), agencies will be better prepared to respond to emergencies and disasters
- The presentation identifies strategies to improve operational resilience of the ITS and the transportation system
- Module Outline
- Background
- Operational Resilience
- ETO
- TIM
- Strategies
- Questions
Author’s Slide 3 meeting notes below:
Module 14 provides basic information on ITS can support response to emergencies and disasters.
The presentation identifies strategies to improve operational resilience of the ITS and the overall transportation system as well as best practices in ETO and TIM that aid in responding to emergencies and disasters.
Module Outline
- Background, including transportation trends
- Operational Resilience
- ETO
- TIM
- Strategies
- Questions
Slide 4:
Learning Objectives
- This module examines how ITS can be used in response to emergencies and disasters through increasing operational resilience (including maintaining the resilience of ITS), implementing ETO and TIM best practices, and applying strategies to support overall system operation. The specific learning objectives of this module are the following:
- Define operational resilience as it relates to ITS
- Provide a basic introduction ETO and TIM practices
- Identify how to make ITS infrastructure and related systems resilient to natural and human caused events
- Identify how to use ITS to make the transportation system more resilient to changes in nonrecurring events (e.g., incidents, emergencies, and disasters) and use ITS to detect and respond to the impacts of these events
- Identify how ITS can support ETO and TIM for greater system performance
Author’s Slide 4 meeting notes below:
The learning objectives for this module are:
- How can we use ITS to improve response to emergencies and disasters
- Define operational resilience as it relates to ITS
- Provide a basic introduction ETO and TIM best practices
- Identify how to make ITS infrastructure and related systems resilient to natural and human caused events
- Identify how to use ITS to make the transportation system more resilient to changes in nonrecurring events (e.g., incidents, emergencies, and disasters) and use ITS to detect and respond to the impacts of these events
- Identify how ITS can support ETO and TIM for greater system performance
Slide 5:
BACKGROUND
Author’s Slide 5 meeting notes below:
First, we will give a little background to help frame the discussion for this module.
Slide 6:
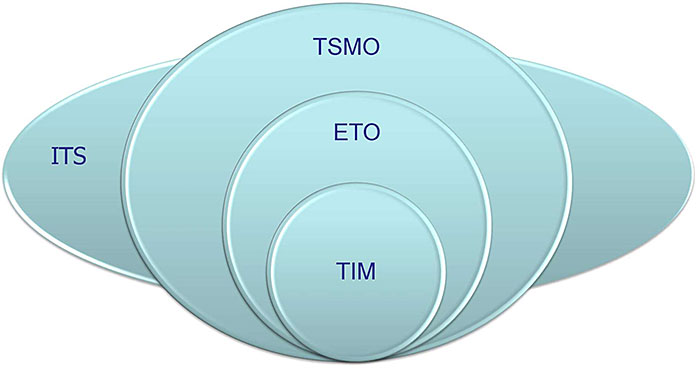
Operational Resilience, ETO, TIM Relationship
Author’s Slide 6 meeting notes below:
This is the general hierarchy we use in this Module. You can argue if these are perfect concentric circles or if these circles should overlap, but the authors are following this general hierarchy: ITS is the broad discipline encompassing TSMO, ETO, and TIM. TSMO is a major effort to operate and manage the network. ETO are a series of strategies that are part of TSMO (there could be some ETO strategies that are beyond TSMO, but we will not dwell on that). We do consider TIM a subset of ETO.
Slide 7:
Transportation Trends
- Climate Change Impacts1
- Softening and buckling of pavements
- Buckling of rail track for heavy and light rail
- Overheating of vehicles
- Limitations on when construction / maintenance activities can be conducted
- Flooding of coastal roads, tunnels, and rail lines
- Erosion of road base and bridge supports (scouring)
- Increase in weather-related delays and traffic disruptions
- Increase in wildfires impacting visibility for drivers and closing roads
- More frequent, and potentially extensive, emergency evacuations
- Impacts to port and ferry terminals operations
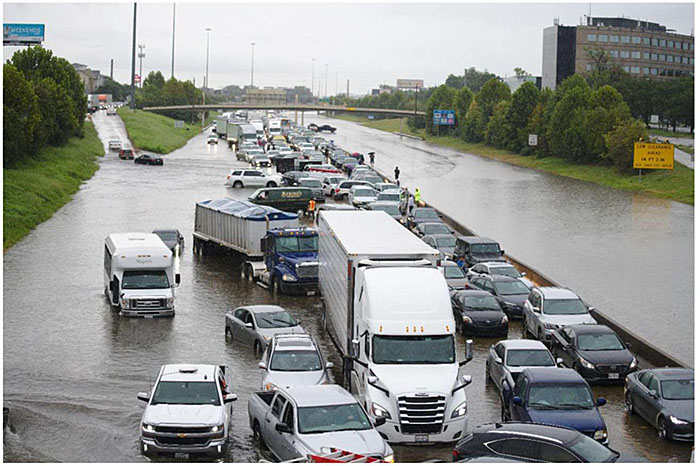
Hurricane Flooding Impacts on Transportation. Source: Sean Hannon acritelyphoto / Shutterstock.com
1 Climate Change Adaptation Guide for Transportation Systems Management, Operations, and Maintenance, FHWA-HOP-15-026, 2015 (Ref #7).
Author’s Slide 7 meeting notes below:
There are several trends that are impacting transportation. One of first is climate change. Climate change, through more variation in weather patterns - both warm and cold climates, can cause the following impacts:
- Softening and buckling of pavements
- Buckling of rail track for heavy and light rail
- Overheating of vehicles
- Limitations on when construction / maintenance activities can be conducted. It is possible, in cold-weather climates, climate change could result in longer construction seasons
- Flooding of coastal roads, tunnels, and rail lines, as shown in the figure, rainfall from hurricanes can cause severe impacts to roadways
- Erosion of road base and bridge supports (scouring)
- Increase in weather-related delays and traffic disruptions
- Increase in wildfires impacting visibility for drivers and closing roads
- More frequent, and potentially extensive, emergency evacuations
- Impacts to port and ferry terminals and operation
Slide 8:
Transportation Trends (cont.)
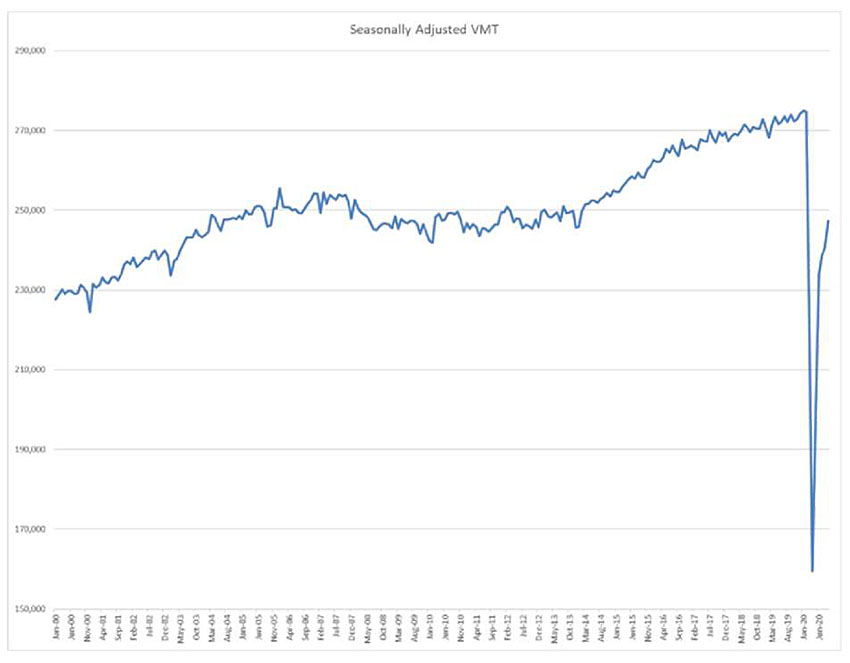
- Travel Demand Growth
- Technology Automation
- All Electronic tolling
- Automated vehicles
- Machine-to-machine interfaces
- Alternate Transportation Technology
- Advanced driver assistance systems
- Mobility-on-demand
- Mobility-as-a-service
Author’s Slide 8 meeting notes below:
Other trends that are impacting transportation are the following:
- Growing travel demand in terms of vehicle miles of travel - as shown in the graph, VMT has been growing over the past 20 years. This graph shows both the dip in demand for the financial crisis of 2007/2008 and the significant drop in demand during the 2020 Covid Pandemic. In both cases demand has returned.
- Technology Automation, examples are all electronic tolling replace toll takers and emergence of automated vehicles that will see more machine-to-machine interfaces, taking the driver out of the loop
- Alternative forms of transportation enabled by technology
Slide 9:
Transportation Trends (cont.)
- Big Data
- NCHRP 904 on Leveraging Big Data to Improve TIM recommends the following:
- Adopt a deeper and broader perspective on data use
- Collect more data, process the data, and manage the data for TIM
- Use a common data storage environment and share data with others
- Adopt cloud technologies for the storage and retrieval of data
- Open and share outcomes and products to foster data user communities
- Transportation Funding
- Last federal gas tax increase was 1991
- Electric/hybrid vehicles reduce gas consumption
- Constrained budgets at state and local level
- Alternate Approaches
- Funding programs
- Congestion Mitigation/Air Quality, Highway Safety Improvement, National Highway Performance, Surface Transportation
- Private Sector funding
- State Farm and Houston Automobile Dealers Assoc.

Author’s Slide 9 meeting notes below:
Other trends that are impacting transportation are the following:
- Big Data
- NCHRP 904 listed several guidelines for using Big Data to improve TIM.
- Transportation funding
- Revenues are decreasing due to no gas tax increases, more electric vehicles, and constrained state and local budgets
- However, many state and local agencies have found alternative ways to fund through federal funding programs and private sector contribution
Slide 10:
PREPARING FOR RESPONSE TO EMERGENCIES AND DISASTERS
Author’s Slide 10 meeting notes below:
Let’s first look at Operational Resilience.
Slide 11:
Operational Resilience
- Department of Homeland Security (DHS), Federal Emergency Management Administration (FEMA)
- “A prepared and resilient Nation”
- Transportation Research Board (TRB) Operational Resilience ETO Subcommittee (ACP10-1) of the Standing Committee on Regional TSMO
- “…the ability to prepare and plan for, absorb, recover from, or more successfully adapt to actual or potential adverse events…”
- Key points:
- Prepare
- Anticipate
- Absorb - continue to provide services during adverse conditions
- Recover
Author’s Slide 11 meeting notes below:
One way of preparing for emergencies and disasters is to improve the Operational Resilience of the transportation System.
The Federal Emergency Administration (FEMA) under the Department of Homeland Security, has defined in the strategic plan a vision of “A prepared and resilient Nation.”
In addition, the subcommittee on Operational Resilience under the Transportation Research Board’s Regional Transportation System Management and Operation Committee defines Operational Resilience as “the ability to prepare and plan for, absorb, recover from, or more successfully adapt to actual or potential adverse events.”
The key points in these definitions are preparedness, anticipation, ability to absorb and continue to provide services during adverse conditions, and the ability to recover.
Slide 12:
Operational Resilience Pillars
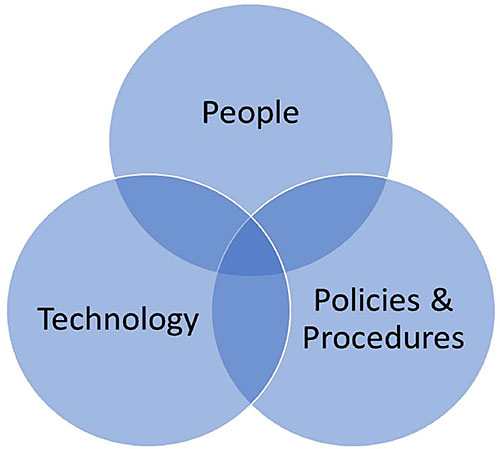
Author’s Slide 12 meeting notes below:
Operational Resilience is dependent on 3 things:
- People
- Technology
- Policies and procedures
Operational resilience cannot be accomplished without all 3 in place. If you don’t have the policies, procedures, business rules, and guidance in place, people are not able to accomplish their job functions.
Slide 13:
ITS & Operational Resilience
- ITS must include operational resilience in its planning, design, deployment and maintenance
- Events impact ITS
- Cannot lose ITS when it is needed most
- ITS can be used to improve the operational resilience of the transportation system
- Events, small and large, need ITS to conduct ETO and TIM
Author’s Slide 13 meeting notes below:
There are two aspects of Operational Resilience. First, is that the ITS itself must be planned, designed, deployed, and maintained in order to be resilient. Events that impact the transportation system also impact ITS. A region or agency cannot lose their ITS when they need it most during an event.
Second, the transportation system must be resilient. ITS can be used to improve the operational resilience of the overall transportation system. ETO and TIM are frequently needed during events, depending on their size. The ITS is in place to support both ETO and TIM to help restore operation of the transportation system.
Slide 14:
EMERGENCY TRANSPORTATION OPERATIONS
Author’s Slide 14 meeting notes below:
Next, let’s look at Emergency Transportation Operations
Slide 15:
Emergency Transportation Operations
- ETO events can include the following:
- Minor Traffic incidents
- Planned Special Events
- HazMat Incidents
- Wildfires
- Major Storms
- Malevolent Acts
- ETO, as well as most TIM response, uses the National Incident Management System (NIMS)
- The major functions are as follows:
- Command and Management
- Preparedness
- Resource Management
- Communication and Information Management
- Supporting Technologies
- Ongoing Program Management & Maintenance
Author’s Slide 15 meeting notes below:
ETO can cover a number of different types of events, ranging from traffic incidents, to natural disasters, to malevolent acts such as terrorist attacks.
ETO, as well as most TIM response, uses the National Incident Management System (NIMS) to functionally organize its products and information around its programs. The major functions are as follows:
- Command and Management
- Preparedness
- Resource Management
- Communication and Information Management
- Supporting Technologies, and
- Ongoing Program Management & Maintenance.
Slide 16:
Event Severity and Frequency
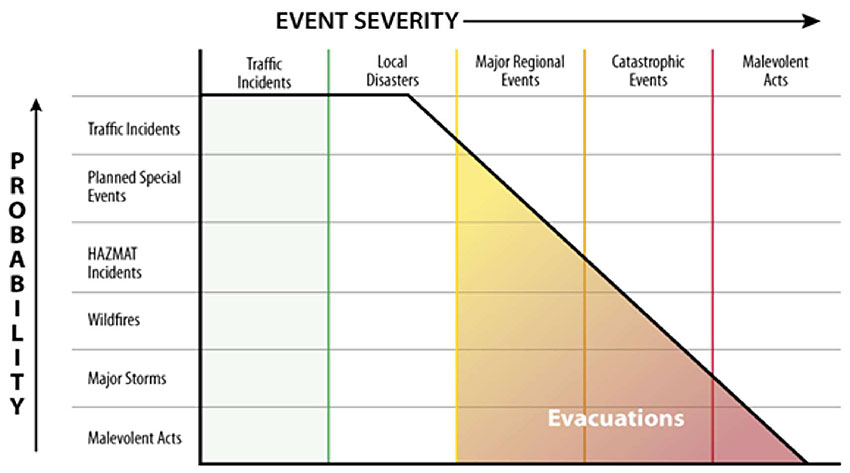
Source: Federal Highway Administration, USDOT
Author’s Slide 16 meeting notes below:
The good news is that the frequency of events generally decreases with the severity of the event. Traffic incidents are most common, occurring daily on many roadway segments. Catastrophic events or malevolent events, like terrorism, have a major impact, but happen far less frequently. Those severe events can require evacuations.
Slide 17:
ITS Support to ETO
- Historically, ITS elements support ETO
- Roadway sensors to collect traffic conditions
- Dynamic message signs (DMS) to post traveler information
- CCTV cameras for surveillance
- Advanced strategies
- Road weather management (RWIS, environmental sensors, automated vehicle location for winter weather maintenance vehicles)
- Traveler information services (511 systems, traveler information websites, media alerts)
- Traffic control strategies (traffic signal systems, ramp metering, vehicle-to-infrastructure (V2I) and vehicle-to-everything (V2X) applications
- Connected and automated vehicle (CAV) systems
- Coordinated roadway strategies for construction, maintenance, and special events
- Interoperable voice communications
- Redundance data and communication networks to support ITS
Author’s Slide 17 meeting notes below:
Historically, ITS elements such as roadway sensors, dynamic message signs, and CCTV cameras have been used to collect traffic data, disseminate traveler information, and conduct surveillance on traffic conditions.
As ITS continues to mature, there are more advanced strategies that can help support ETO such as road weather management, traveler information services, traffic control, connected and automated vehicle systems, work zone/maintenance management, and special event management.
In addition, having redundant data and communication system to support ITS will ensure those systems are there to support ETO.
Slide 18:
TRAFFIC INCIDENT MANAGEMENT
Author’s Slide 18 meeting notes below:
Next, let’s look at traffic incident management.
Slide 19:
Traffic Incident Management
- Incident Definition
- Any non-recurring event that causes a reduction of roadway capacity or an abnormal increase in demand
- Such events include traffic crashes, disabled vehicles, spilled cargo, highway maintenance and reconstruction projects, and special non-emergency events
- ITS Components
- Detection
- Surveillance
- Communication
- TIM Benefits:
- Reduces duration and impacts of incidents
- Reduces the exposure of travelers, victims, and responders to hazardous conditions
- Improves safety
- Reduces secondary incidents
- Potential to reduce congestion, fuel consumption, emissions, travel time, vehicle operating costs
Author’s Slide 19 meeting notes below:
A common definition for an incident is “any non-recurring event that causes a reduction of roadway capacity or an abnormal increase in demand.”
Such events include traffic crashes, disabled vehicles, spilled cargo, highway maintenance and reconstruction projects, and special non-emergency events.
Common ITS components are traffic detection, surveillance, and telecommunications. TIM has the following potential benefits:
- Reduces duration and impacts of incidents
- Reduces the exposure of travelers, victims, and responders to hazardous conditions
- Improves safety
- Reduces secondary incidents
- Potential to reduce congestion, fuel consumption, emissions, travel time, vehicle operating costs
Slide 20:
Incident Scale
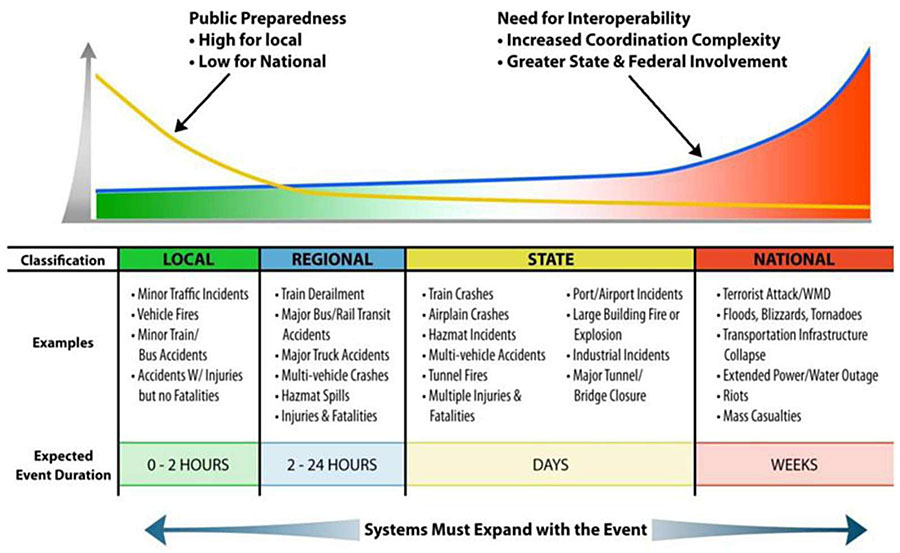
Source: John Hopkins University
Author’s Slide 20 meeting notes below:
The following graphic from John Hopkins University shows examples of incidents and how the scale of the event increases with the expected duration. The graphic also shows how the responsibilities between local, state, and national agencies shifts as the scale of the incident changes.
Slide 21:
Incident Timeline
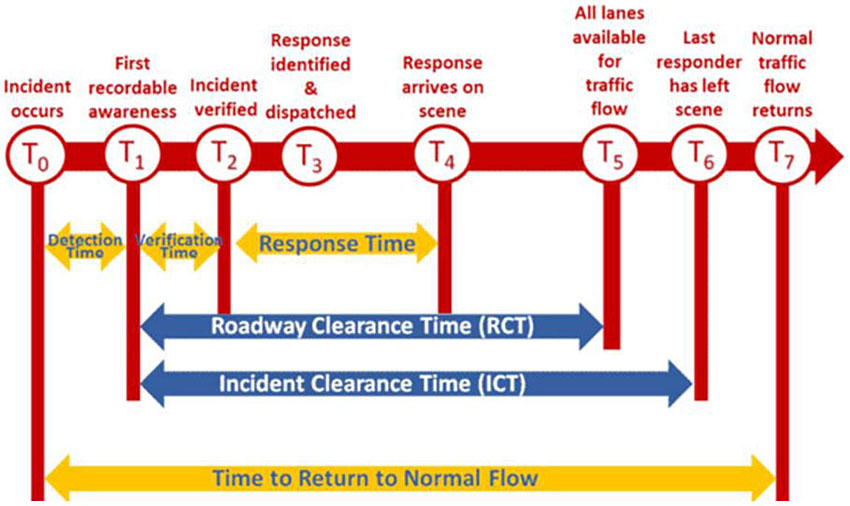
Source: Federal Highway Administration, USDOT
Author’s Slide 21 meeting notes below:
The following graphic shows the common accepted incident timeline.
The timeline shows the occurrence of key milestones throughout the duration of an incident event, ranging from the initial occurrence of the incident at Time Zero to the return to normal flow at Time Seven.
Other key times are:
Detection Time - the time from first occurrence to first recordable awareness - Time One minus Time Zero
Verification Time - time from first recordable awareness to verification - Time Two minus Time One
Response Time - time from first recordable awareness to time response arrives on scene - Time Four minus Time One
Roadway Clearance Time - time from first recordable awareness to when all lanes are cleared - Time Five minus Time One
Incident Clearance Time - time from first recordable awareness to when last responder has left scene - Time Six minus Time One
And again, the overall time from when the incident occurs to when normal traffic flow returns is “time to Return to Normal Flow” - If the incident occurs during a peak period, that normal flow may not be free-flow, but the normal conditions during that peak period.
Slide 22:
TIM Partners
- TIM’s multi-disciplinary approach involves a number of public and private sector partners, including the following:
- Transportation IOOs
- Law Enforcement
- Fire and Rescue
- Emergency Medical Services
- Coroners and Medical Examiners
- Emergency Management
- Towing and Recovery
- Hazardous Materials Contractors
- Public Safety Communications
- Traffic Information Media
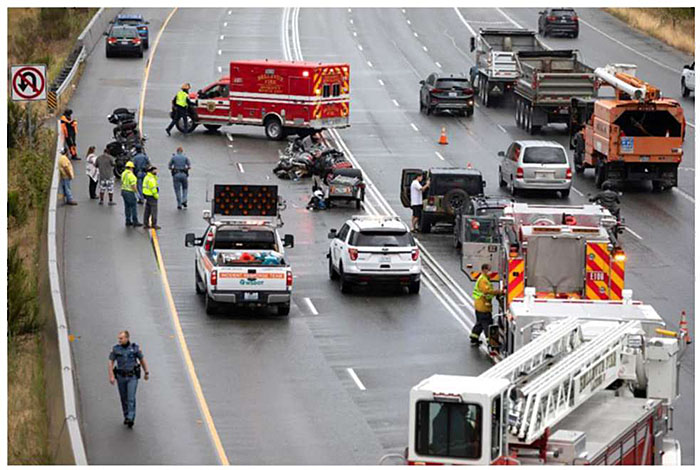
Photo courtesy of VDB Photos / Shutterstock.com.
Author’s Slide 22 meeting notes below:
Here is a of the various partners that may be part of the response to an incident.
- Transportation IOOs
- Law Enforcement
- Fire and Rescue
- Emergency Medical Services
- Coroners and Medical Examiners
- Emergency Management
- Towing and Recovery
- Hazardous Materials Contractors
- Public Safety Communications
- Traffic Information Media
Slide 23:
TIM Strategies
- Maryland DOT
- Maryland Coordinated Highways Action Response Team (CHART) uses TIM response and clearance data for performance measurement
- In 2019, TIM performance data showed the following:
- Average incident duration was 24% shorter (8 min shorter than the 34 min avg)
- Number of severe incidents blocking 3+ lanes decreased 5%
- Estimated number of secondary crashes was reduced by 365 crashes
- Maricopa County, Arizona
- Arterials comprise 3/4th of region’s lane miles and 2/3rd of all travel
- Regional Emergency Action Coordination Team (REACT) provides assistance to local agencies within Maricopa county for TIM on arterials
- Participating jurisdictions: Scottsdale, Avondale, Tolleson, Glendale, Peoria, and Surprise, Arizona.
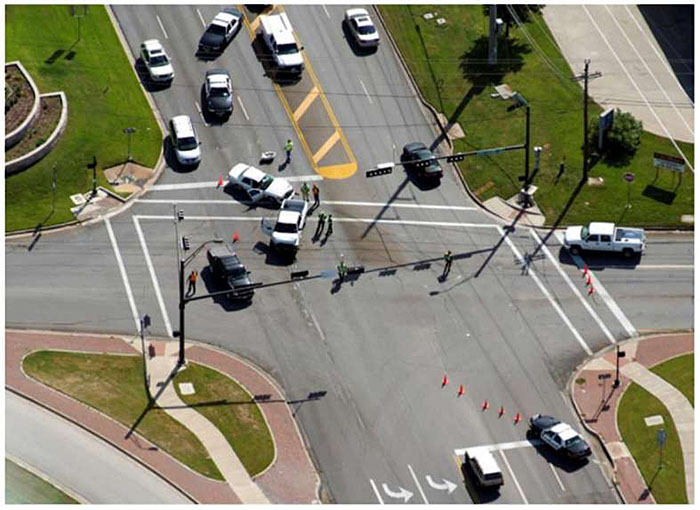
Photo courtesy of Texas A&M Transportation Institute.
Author’s Slide 23 meeting notes below:
Two examples of TIM best practices are in Maryland and Arizona.
In Maryland, Maryland CHART is using data for performance monitoring of the TIM program. This has resulted in significant benefits to the agency.
In Arizona, the county has extended their TIM program to the local agencies on arterial roads, they have a half dozen agencies participating.
Slide 24:
TSMO Strategies to Support ETO & TIM
- Work zone management (real-time location and monitoring of work zones)
- Planned Special Event Management (advanced planning and operational strategies)
- Road weather management (environmental sensors, automate vehicle location for winter weather maintenance vehicles)
- Traveler information (511 systems, traveler information websites, media alerts)
- Traffic signal coordination (signal phase and timing for improved corridor operation)
- Ramp management (detection and metering to manage local and corridor traffic)
- Active Transportation and Demand Management (variable speed limits, dynamic lane and shoulder use, real-time alternate routing)
- Integrated corridor management (freeway, arterial, and transit strategies deployed cooperatively to maximize corridor throughput, mobility, and safety)
- Connected and automated vehicle (CAV) Deployment (vehicle-to-infrastructure (V2I) and vehicle-to-everything (V2X) applications to alert vehicles and drivers)
- Technology and data strategies to support ETO and TIM:
- Interoperable voice communications
- Redundance data and communication networks to support ITS
- Remote access to data and ITS
Author’s Slide 24 meeting notes below:
There are also several TSMO strategies that can support ETO and TIM. These strategies are as follows:
Work zone management (real-time location and monitoring of work zones)
- Planned Special Event Management
- Road weather management
- Traveler information
- Traffic signal coordination
- Ramp management
- Active Transportation and Demand Management
- Integrated corridor management
- Connected and automated vehicle (CAV) Deployment
- Technology and data strategies to support ETO and TIM:
- Interoperable voice communications
- Redundance data and communication networks to support ITS
- Remote access to data and ITS 24
Slide 25:
STRATEGIES TO IMPROVE RESPONSE TO EMERGENCIES AND DISASTERS
Author’s Slide 25 meeting notes below:
Next, let’s look at the different strategies that can be pursued to improve operational resilience.
Slide 26:
Strategies - Climate Change
- Traffic Management Strategies to Support Climate Event Response
- Increase in traffic incident management activities
- Use of road and lane closures
- Reduced speed limit or use of variable speed limits
- Disruption of transit service
- Use of road and transit diversions
- Truck restrictions
- Work zone management (to accommodate additional lane closures)
- Adding sensors to alert operating/maintenance/response agencies when flooding is likely/imminent
Source: Transportation Research Board Special Task Force on Climate Change and Energy, Transportation Research Circular E-C152: Adapting Transportation to the Impacts of Climate Change State of the Practice 2011, June 2011.
Author’s Slide 26 meeting notes below:
The following traffic management strategies can be used to keep roadways operating during climate events.
- Increase in traffic incident management activities
- Road and lane closures
- Reduced (and variable) speed limit
- Disruption of transit service
- Road and transit diversions
- Truck restrictions
- Work zone management (to accommodate additional lane closures)
- Adding sensors to alert operating/maintenance/response agencies when flooding is likely/imminent
Slide 27:
Strategies - Climate Change
- FHWA Climate Change and Extreme Weather Vulnerability Framework:
- Define the scope of the vulnerability assessment,
- including key variables, program objectives, and relevant assets
- Assess vulnerabilities through data collection, asset performance, risk assessment, and ratings/prioritization to inform the development of strategies
- Integrate strategies into agency decision making
- Monitor and revise process
Source: Climate Change Adaption Guide for Transportation Systems Management, Operations, and Maintenance, FHWA-HOP-15-026, Federal Highway Administration, USDOT, November 2015.
Author’s Slide 27 meeting notes below:
The FHWA has developed a framework for handling climate change and extreme weather events. Use of this framework can help improve the operational resilience of the transportation system. Those steps are:
- define the scope of the vulnerability assessment, including key variables, program objectives, and relevant assets
- assess vulnerabilities through data collection, asset performance, risk assessment, and ratings/prioritization to inform the development of strategies
- integrate strategies into agency decision making
- monitor and revise process
Slide 28:
Strategies - ETO
- Emergency Operations Centers (EOCs)
- Temporary or permanent EOCs focused on multi-agency response coordination
- Fusion Centers
- Information sharing hubs to support terrorism response, crime prevention, and public safety response
- Mutual Aid
- Reciprocal exchange of people and resources between two or more agencies for mutual benefit
Photo Courtesy of Texas A&M Transportation Institute.
Author’s Slide 28 meeting notes below:
The following strategies can improve emergency transportation operations to support operational resilience.
EOCs can be temporary (possibly mobile) or permanent centers where multiple agencies responsible for emergency response can co-locate to aid in the overall response.
Fusion Centers are a special center focused on information sharing across agencies to support multi-agency response.
Mutual Aid is a practice deployed in many regions through cooperative agreements allowing the sharing of personnel, equipment, and resources among agencies responsible for emergency response and public safety in a region.
Slide 29:
Strategies - Systems in ITS
- Strategies for agencies and their contractors for IT Systems and ITS:
- Adding redundancy (i.e., duplication of critical components or systems to ensure continuity and increase reliability) to the assets or systems (e.g., network, power, etc.)
- Having backup (i.e., copies or spare parts to replace loss) components available at the device and system level (e.g., data, field devices, etc.)
- Allowing for substitution of component or devices
- Designing or redesigning to reduce or eliminate vulnerabilities of products and processes
- Having the flexibility to improvise during incidents and events to make use of on-hand resources (human or material)
- Allowing for priority access for responders
- Modeling disruptions and system operation
- Planning for back up logistics to truly be able to implement backups and substitutions when the time comes
- Regularly run scenario tests to check equipment and system capabilities
Author’s Slide 29 meeting notes below:
In maintaining the systems and field devices needed for ITS, ETO, and TIM, it is important to adopt best practices to make sure those systems are available when needed. Some of those best practices are:
- adding redundancy (i.e., duplication of critical components or systems to ensure continuity and increase reliability) to the assets or systems (e.g., network, power, etc.)
- having backup (i.e., copies or spare parts to replace loss) components available at the device and system level (e.g., data, field devices, etc.)
- allowing for substitution of component or devices
- designing or redesigning to reduce or eliminate vulnerabilities of products and processes
- having the flexibility to improvise during incidents and events to make use of on-hand resources (human or material)
- allowing for priority access for responders
- modeling disruptions and system operation
- planning for back up logistics to truly be able to implement backups and substitutions when the time comes
- regularly run scenario tests to check equipment and system capabilities
Slide 30:
Strategies - Technology
- Unmanned Aerial Vehicles (UAVs, commonly called drones)
- UAVs are increasingly being used in ETO and TIM events to give greater situational awareness
- Connected and Automated Vehicles (CAVs)
- CAVs will be introduced to the public allowing for each vehicle to be a sensor and report situation awareness to other vehicles and transportation agencies
- CAVs also offer the potential to inform the driver and the vehicle directly of events
- Well Maintained Reference Systems
- Graphical Information Systems (GIS) that are well maintained and shared with other agencies and users to allow for a common reference system to aid in response
- New Sensor Technologies
- E.g., Infrared camera technology
- Artificial Intelligence (AI)
- Florida DOT and Nevada DOT using AI with machine vision systems to recognize incidents and “likely” incidents to improve incident detection times
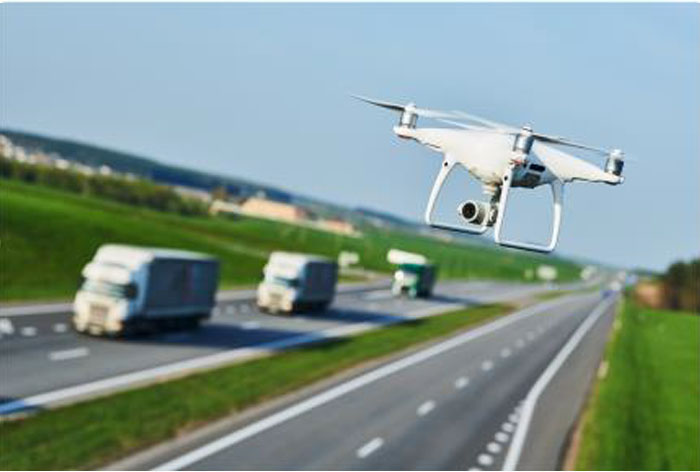
Source: Shutterstock.com
Author’s Slide 30 meeting notes below:
Technology can be used to improve the operational resilience of the transportation system and agency’s response to events. Some examples of those technologies are the following:
UAVs with can provide an aerial view to improve the situational awareness of an incident or emergency scene.
CAVs - while a small percentage of the vehicle fleet today, CAVs offer a new set of probe vehicle data to inform transportation operators of traffic conditions and a new method to communicate back to the vehicles with warnings and alerts about ETO and TIM events.
GIS systems that are well maintained and published to other agencies can benefit all responders from having a common reference system to plan and respond to events.
New emerging technologies will help transportation agencies detect, respond, and communicate as the cost and availability of these technologies improves.
Slide 31:
Strategies - Personnel
- Diverse knowledge, skills, abilities
- Draw from expertise across transportation engineering, transportation planning, electrical/electronic engineering, telecommunications, computer engineering, information technology, data science, artificial intelligence, and cybersecurity
- Automate repetitive job tasks
- Human watching monitors replaced by machine vision systems detecting anomalies and alerting operators to changes in conditions
- Wearable technology
- Sensors on clothes for monitoring humans and situations
- Sensors can deliver additional alerts/warnings to workers
- Intrusion alert systems
- Alert workers of a vehicle entering construction, maintenance, incident scene
- Alert drivers in advance when workers are present
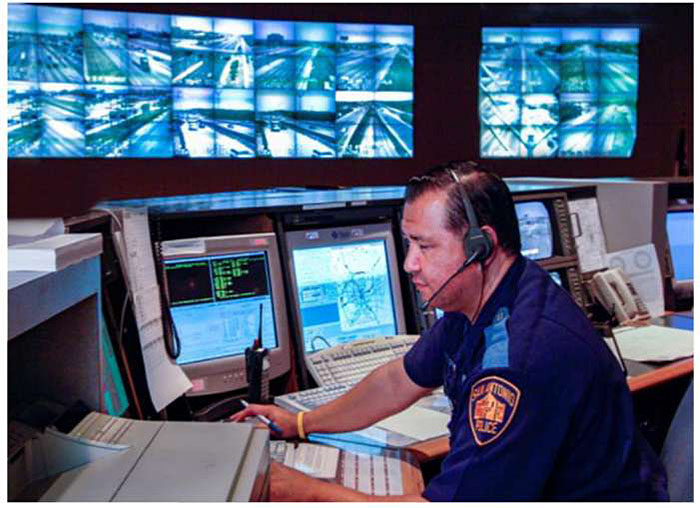
Photo Courtesy of Texas A&M Transportation Institute.
Author’s Slide 31 meeting notes below:
Strategies that can help an agency or improve the performance and safety of agency personnel are:
- Recruit and retain a diverse set of skills and backgrounds that are representative of the evolving technology involved in transportation, ITS, ETO, and TIM.
- Use systems and technology to automate mundane, repetitive tasks that human usually do not perform well over time - example of machine vision searching video images
- Use of wearable technology as it becomes available to act as additional sensors and a mechanism to deliver alerts and warnings
- Intrusion alert systems in the field to warn both workers on the scene and drivers approach a scene of their presence.
Slide 32:
Strategies - IT Systems / Cybersecurity
- Cybersecurity considerations built into the design and operation
- E.g., security credential management system in CAV
- Mitigating cybersecurity threats follows good information technology best practices:
- keep software regularly updated and upgraded
- implement user access management policies and procedures on all accounts
- implement device and data access management policies
- maintain a system and data recovery plan
- actively manage systems and configurations
- proactively detect network intrusions
- leverage hardware security features
- segregate critical networks and services
- integrate threat reputation services
- implement multi-factor authentication
- Applies to an agency, partners, users, and contractors/vendors
Author’s Slide 32 meeting notes below:
The IT profession has established good best practices over time that allow an agency and their contractors to keep those system performing and up-to-date:
- keep software regularly updated and upgraded
- implement user access management policies and procedures on all accounts
- implement device and data access management policies
- maintain a system and data recovery plan
- actively manage systems and configurations
- proactively detect network intrusions
- leverage hardware security features
- segregate critical networks and services
- integrate threat reputation services
- implement multi-factor authentication
Slide 33:
Summary
- Increase in events-natural and human-made--that can impact the transportation system
- Compounded by trends in increased travel demand and levels of available funding
- Transportation agencies increasingly aware of “operational resilience”
- Technologies and systems are evolving to provide greater support to ITS, ETO, and TIM
Author’s Slide 33 meeting notes below:
There is, and will continue to be, and increase in natural and human-made events that impact the transportation system.
These events are compounded by increases in travel demand and the availability of funding to deal with the events.
The good news, is that there is an increasing awareness among transportation agencies of “operational resilience”
Technologies and systems are evolving to provide greater support to agencies and their staff in delivering ITS, ETO, and Tim services to respond to these events.
Slide 34:
References
- Federal Highway Administration, Intelligent Transportation Systems for Traffic Incident Management, FHWA-JPO-07-001, U.S. DOT, January 2007.
- Federal Highway Administration, Transportation Management Center Data Capture for Performance and Mobility Measures Reference Manual, Final Report, FHWA-JPO-13-055, U.S. DOT, March 2013.
- Federal Highway Administration, “Transportation System Preparedness and Resilience to Climate Change and Extreme Weather Events,” Order 5520, U.S. DOT, December 2014.
- Federal Highway Administration, Traffic Incident Management Handbook, FHWA-HOP-10-013, U.S. DOT, January 2010.
- Federal Highway Administration, “2019 Traffic Incident Management Capability Maturity Self-Assessment National Analysis Report,” U.S. DOT, November 2019.
- Federal Highway Administration, Traffic Incident Management (TIM) Self-Assessment Guide, U.S. DOT, March 2004.
Author’s Slide 34 meeting notes below:
These are a listing of the references used in creating Module 14.
Slide 35:
References - cont.
- Federal Highway Administration, Climate Change Adaption Guide for Transportation Systems Management, Operations, and Maintenance, FHWA-HOP-15-026, U.S. DOT, November 2015.
- Transportation Research Board, Transportation Systems Management and Operations Workforce Guidebook, NCHRP 20-07/Task 408, March 2019.
- Federal Highway Administration, Simplified Guide to the Incident Command System for Transportation Professionals, U.S. DOT, 2006.
- Federal Highway Administration, Raising Awareness of Artificial Intelligence for Transportation System Management and Operations, U.S. DOT, 2019.
- Federal Highway Administration, “Transportation System Resilience to Extreme Weather and Climate Change: Technical Staff Fact Sheet,” FHWA-HOP-15-025, U.S. DOT, November 2015.
Author’s Slide 35 meeting notes below:
These are a continuation of the references used in creating Module 14.
Slide 36:
Websites
- National Operations Center of Excellence (NOCoE), www.transportationops.org
- Federal Emergency Management Agency Training, Emergency Management Institute, www.training.fema.gov/nims/
- Emergency Responder Safety Institute, https://www.respondersafety.com/
- SHRP2Solutions, Federal Highway Administration, National Tim Responder Training, https://www.fhwa.dot.gov/goshrp2/Solutions/Reliability/L12_L32A_L32B/National_Traffic_Incident_Management_Responder_Training_Program
- Federal Highway Administration, Emergency Transportation Operations for Disasters, https://ops.fhwa.dot.gov/tim/
- https://onlinepubs.trb.org/onlinepubs/conferences/2018/RISE/Presentations/P.Pisano.Capability_Maturity_Self-Assessment_Tools.FHWA.SilverRoom.09102018.pdf
- https://ops.fhwa.dot.gov/publications/publications.htm
Author’s Slide 36 meeting notes below:
These are some key websites referenced in Module 14.
Slide 37:
Questions
Author’s Slide 37 meeting notes below:
Are there any questions about the concepts and strategies covered in this presentation?
Return to top ↑