← Back to Module 4
ITS ePrimer Presentation
Module 4: ITS Data in Decision Making
Slide 1:

ITS ePrimer
Module 4: ITS Data in Decision Making
ITS Professional Capacity Building Program
ITS Joint Program Office
U.S. Department of Transportation

Author’s Slide 1 meeting notes below:
This is the title slide. The following slides are in this order:
- Instructor
- Learning Objectives
- Content-related slide(s)
- Summary (what we have learned)
- References
- Questions?
This module is sponsored by the U.S. Department of Transportation’s ITS Professional Capacity Building (PCB) Program. The ITS PCB Program is part of the Research and Innovative Technology Administration’s ITS Joint Program Office.
Thank you for participating and we hope you find this module helpful.
Slide 2:
Instructor

Vaishali Shah
Senior Program Director
Transportation Systems
AEM Corporation, Herndon, VA, USA
Author’s Slide 2 meeting notes below:
Vaishali Shah specializing in bringing transportation systems innovations to practice at the Federal, state, and local level to improve transportation decision making at every level. From Intelligent Transportation Systems (ITS) for roadway systems, to Terminal Flight Data Manager (TFDM) for airports and airspace, and currently the Crowdsourcing for Advancing Operations, an FHWA Every Day Counts Round 5 and 6 (EDC-5/6) Innovation, she helps agencies identify and communicate the right data-informed messaging for improved planning, investment, human capital, and operations decisions.
Vaishali is the Senior Program Director for Transportation Systems at Applied Engineering Management (AEM) Corporation where she leads multiple Federal Highway Administration (FHWA) projects in Transportation Systems Management and Operations (TSMO) such as predictive analytics for traffic management systems and advancing next-generation traffic incident management technologies. She recently served as the principal investigator for the National Cooperative Highway Research Program (NCHRP) study on Business Intelligence Techniques for Transportation Agency Decision Making. She also serves on the Transportation Research Board (TRB) Freeway Operations Committee (ACP20) and contributes to multiple TRB Regional Transportation Systems Management and Operations (RTSMO) subcommittees.
Vaishali brings expertise in the development and use of simulation, modeling, and advanced analytic to improve transportation decision making. She helps agencies navigate the acquisition life cycle, focusing on concept of operations and the business case for complex transportation systems. She has led systems engineering, acquisition, and implementation for programs that range from $1M to $400M. Vaishali also excels at engaging national, state, and local stakeholders through workshops, focus groups, webinars, peer exchanges, site visits/assessments, and technical assistance to bring together disparate interests to chart a path forward. Recently, Ms. Shah spearheaded technical and logistics support for the Third Senior Transportation and Public Safety Summit, which engaged 120 executives including the US Secretary of Transportation, three modal administrators, State DOT executives, and leadership from 20+ national incident response associations over 1.5-days to accelerate traffic incident management (TIM) adoption across local jurisdictions. She holds a B.S. and M.S. degrees in Civil Engineering from the University of Maryland and the University of Texas at Austin, respectively.
Slide 3:
Learning Objectives
- Learn through examples - data-informed decision making.
- Identify sources, content, and differences among ITS and newer data.
- Understand the role of performance management and analytics in bridging the data to decision making divide.
- Recognize the difference between traditional and modern management, and how the latter better supports improved decision making.
Author’s Slide 3 meeting notes below:
State and local agencies are at the crest of integrating data, applying new data, and leveraging advanced analytics to improve strategic, real-time, and predictive decisions that can save agencies resources and operator workload, offer new capabilities, and improve customer service. The end results are improved safety, reliability, accessibility, and efficiency (cost/resource) of travel.
Slide 4:
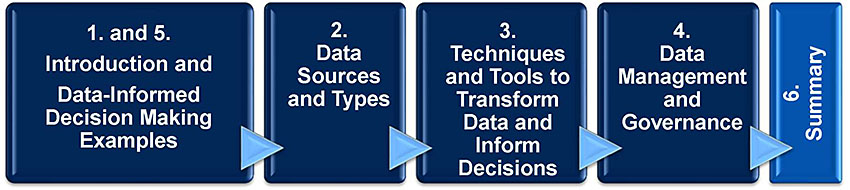
Presentation versus Module Organization
Module 4 Report: ITS Data in Decision Making
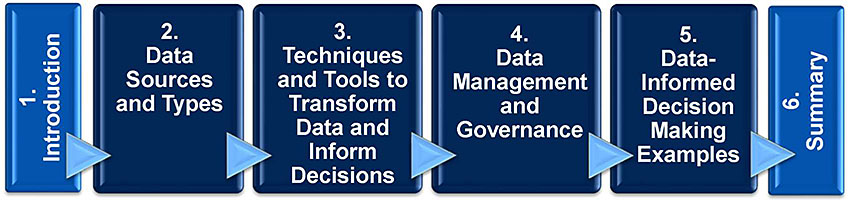
This Presentation Begins with Examples
Slide 5:
Slide 6:
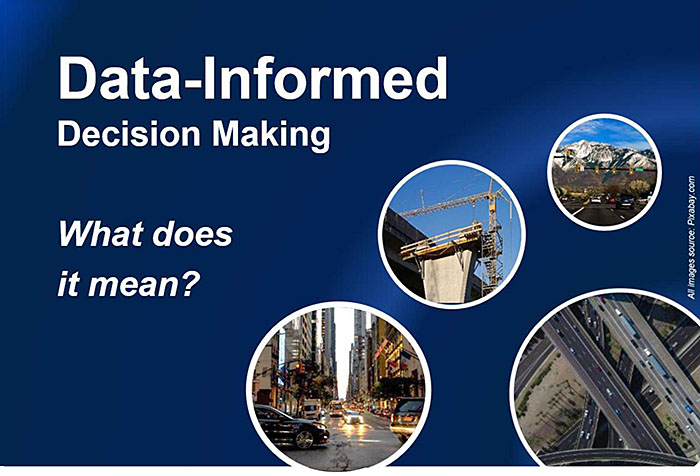
Why Data-Informed Decision Making?
- Using the right data to make decisions more quickly, simply, consistently, transparently, proactively, and more optimally to efficiently deliver on the agency’s mission, goals, and objectives.
- Relevant to every level of an organization and every business line from the front-line operator to the Director or Administrator’s office.
Source: Shah et al., 2019
Author’s Slide 6 meeting notes below:
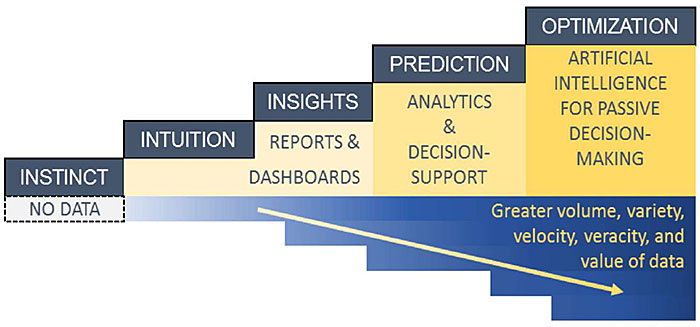
Key Message: Data should inform and improve decision making at every level of an organization and every line of business.
Data-informed decision making evolves processes that are instinct- and intuition-driven to those that apply insights from data through reports, dashboards, decision support systems that leverage advanced analytics and even artificial intelligence.
- It can be as simple as making basic data more accessible. For example, by converting paper, or phone -based data systems to digital based systems that allow multiple users to access to a single view of relevant data when and where needed.
- It can be transforming processes from manual analyses that take weeks using spreadsheets and asking dozens of departments for data to automated analyses on demand.
- It can be complex ad-hoc analyses that form models, or even self-supervised machine learning models, that predict congestion, pavement, or incident conditions for the next 15 minutes or four hours.
Data can and should inform decisions at every level of an organization
- From the front-line operator at a traffic management center or the maintenance worker or snow-plow operator, or the traffic engineer planning how to retime a specific signal or signalized corridor.
- To the executive office choosing a new learning management system or funding tradeoffs across asset, operations, and division offices.
The focus should be on bringing trustworthy, relevant information to the hands of the decision-maker so that the individual or group is able to make decisions that are consistent, quick, transparent, and that more optimally deliver on the goals and objectives of the decision-maker and the enterprise as a whole.
Slide 7:
Decision Making: Front Line
Queue monitoring by off-duty law enforcement officer at a work zone using the Delta Speed tool
-Indiana DOT
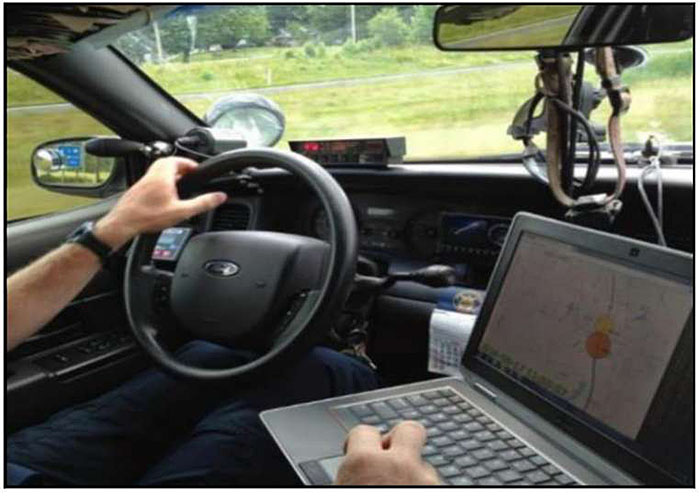
Source: Indiana DOT
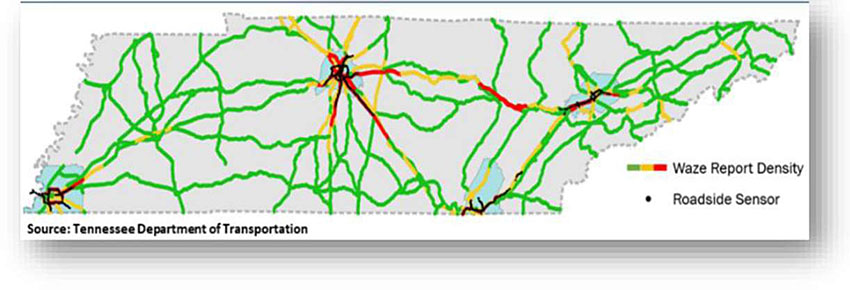
Better maintenance priorities using crowdsourced data from 511 app and Waze
-Delaware DOT
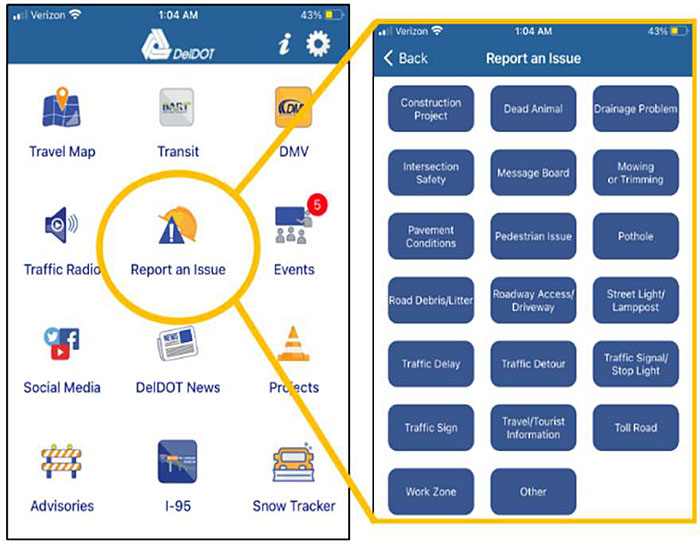
Source: Delaware DOT
Author’s Slide 7 meeting notes below:
Key Message: The front-line decision making involves simple, targeted real-time data made accessible when and where needed. The data may not require advanced analytics but will typically need filtering to ensure operators are not inundated with too much information or irrelevant information. The decisions are made in a matter of seconds, minutes, daily, or at most weekly. The effects of front-line decisions, can have huge safety implications, but are generally “short lived,” maybe a few hours or a few days.
Here are two examples of front line decision making:
- The first is Indiana DOT through collaboration with Purdue University developed a tool that is available to the Traffic Management Center (TMC), and broader stakeholders such as work zone teams and what you see in the left picture, law enforcement. The tool provides real time map-interface visual alerts when the speed on road segments declines significantly. The tool uses data from a vehicle probe provider streamed minute by minute. Once viewing the data, an off-duty police officer at a work zone may decide to circle back to explore the nature of the queue. In parallel, a TMC operator may focus a CCTV camera if available at that location, or the operator may decide to send resources to assess the scene.
- Another example of data used to facilitate front-line decisions is the Delaware DOT app wherein a user can report a host of 19 common issues as well as any other issues -from a pothole to a traffic delay. This data is made available in real-time to TMC operators who can channel a response in a timely manner to the correct authority.
Slide 8:
Decision Making: Program/Project Level
VDOT Mission: “Enable easy movement of people and goods” I-81 Corridor: Highest truck volume and highly unreliable travel times 51% of the delay was caused by incidents
Decision: Invest in Traffic incident Management Program
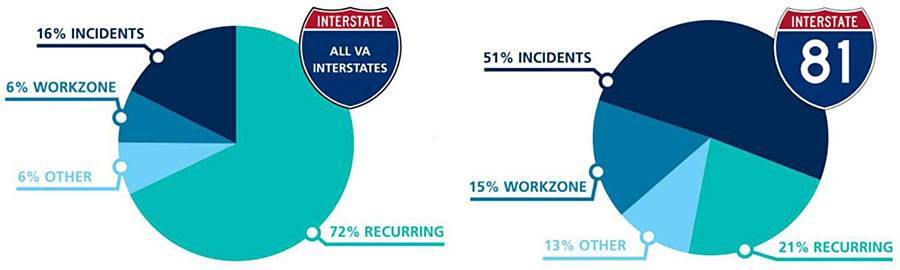
Source: Virginia DOT
Author’s Slide 8 meeting notes below:
Key Message: Program or project-level decision making will typically require more complex analysis, a potential integration of data from different business units. These decisions are less about real-time information, and more about trends over time, comparatives by geography, facility.
By leveraging better data management and analytics, what traditionally were days, weeks, and months of analyses may now be supported through a few self-directed queries of internal data dashboard query tools. The effects of these decisions are not immediate but more long-term - months or even years. The scope of impact is also localized to the project or Program. The decision can be reviewed and revised - potentially quarterly, or annually.
The example you see in this visual is that of data aggregated over a long period of time for all Virginia Interstates and compared for one roadway, I-81. The ability to access the relevant data archives and conduct this analysis helped Virginia DOT more efficiently allocate resources balancing capacity expansion needs with improved traffic incident management strategies.
Slide 9:
Decision Making: Enterprise Level
Ohio DOT strategically redesigned their asset management process in year 2017. Estimated $400M savings over 6 years by:
- Considering lifecycle costs
- Emphasizing pavement preservation treatments
- Collaborative and consistent decision-making procedures
Ohio DOT invested in accessible data and decision support tools.
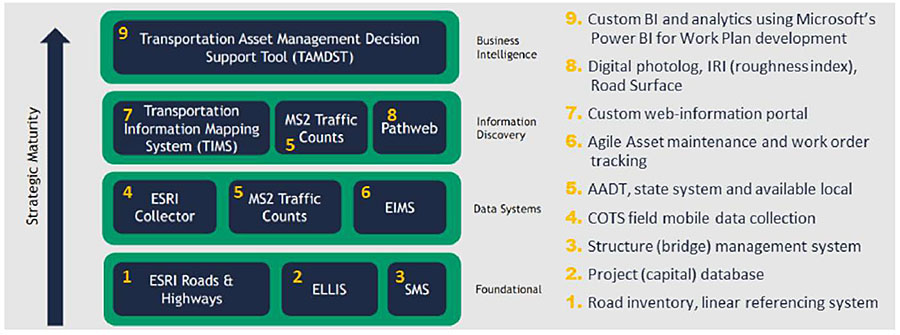
Source: Ohio DOT
Author’s Slide 9 meeting notes below:
Key Message: Enterprise-level decisions typically require significant focus, formal cost/benefit analyses, strategic alignment with elected official priorities, but have lasting impacts for the agency as a whole. Investment decisions with enterprise systems and processes.
The Ohio DOT “Transportation Information Mapping System (TIMS) helps planners, engineers, and executives both access and manage key asset, safety, and operational data in a web-based integrated map-based format.”
- TIMS is available to the enterprise and the public. The tool also enables condition, performance, investment, and planning reports.
- Through their Collector Program, Ohio DOT eliminated data silos, integrated data from culverts, underdrains, signs, right of way, barriers, and outfalls, and is integrating ITS/signals, retaining walls, tower lighting, and inspection data using mobile data collection.
Ohio Department of Transportation. Transportation Asset Management Plan. May 2016. https://www.transportation.ohio.gov/programs/asset-management/resources/asset-management-plan
Hale, Stephen. 2018. “Better Data for Better Decisions.” TRB Webinar on Current and Evolving Practices in Asset Management for Highway Agencies. https://onlinepubs.trb.org/onlinepubs/webinars/180807.pdf.
Slide 10:
Slide 11:
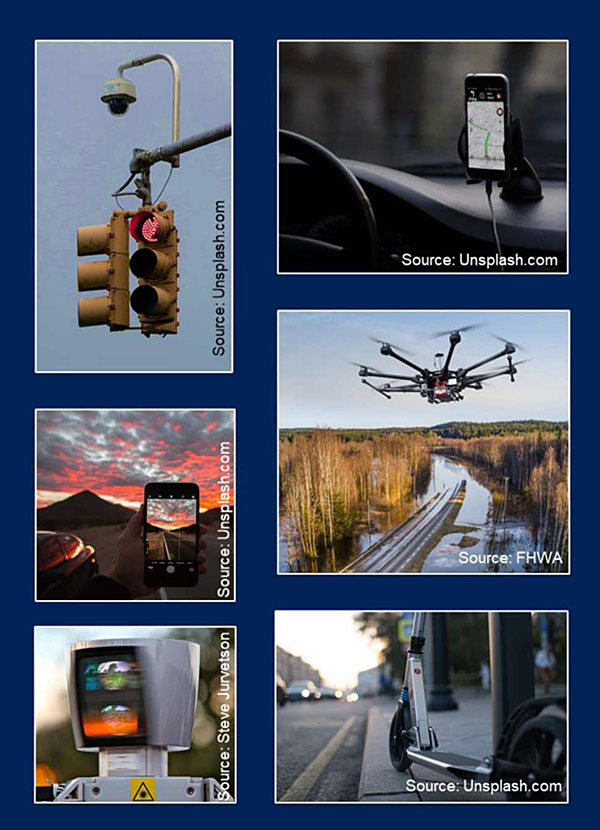
Data is Expanding
- Traditional and newer ITS infrastructure-based data
- Traffic operations data
- Transportation-adjacent data
- Emerging technology data
- Crowdsourced data
Ownership, cost, management, quality/consistency, structure, sensitivity, timeliness, analytics needs, and other factors at play.
Author’s Slide 11 meeting notes below:
Key Message: The data landscape is evolving from where the public transportation agency generates and controls data to where data are generated and controlled by entities outside the transportation agency. We will delve into the “newer” data that reflect the transition from agency generated to private sector generated data.
Traditional Data from ITS infrastructure are typically under the ownership and control of transportation agencies, although potentially managed using vendor products.
- They include loop detectors, magnetic sensors and detectors, video image processors, microwave radar sensors, laser radars, passive infrared and acoustic array sensors, ultrasonic sensors, plus combinations of sensor technologies.
- In instances of vendor-managed data, local or state agencies have at times encountered difficulty changing suppliers and systems, due to scale, compatibility, or learning effects.
- Much of the data are structured, fitting well in a relational database, except for digital video data (e.g., closed circuit television or automated license plate readers).
- Traditional Data from ITS infrastructure require roadside (either pavement embedded, above the road, or along the side of the road) technology installation and maintenance. They also require information communication from the roadside to a centralized data processing and analysis capability, typically through fiber or cellular services.
- The quality of this data is tied to the agency’s ability to detect sensor drift and perform routine and timely recalibration, as well as maintain the precise location of sensors.
- The same can be said for Traffic Operations data - refers to data recorded by Traffic Management Center operators, safety service patrol operators, road maintenance crews, either manually or through automated tools. Many other operations decision data such as variable message signs postings of travel times, advisories, or variable speed limits are typically automatically logged within the ATMS. The TMC may also log activation and duration for dynamic ramp metering rates, dynamic part-time shoulder use, and other active traffic and demand management strategies. These structured, semi-structured, and often geocoded data support the refinement of operational strategies for traffic and demand management.
Slide 12:
Emerging Technology Data
- The availability of low-cost communications and sensors offers new opportunities from the following:
- Transportation network companies (TNC) and micromobility
- Connected vehicle, traveler, and infrastructure
- Internet of everything (IoE)
- Unmanned aircraft systems
- These data differ from traditional data in volume, variety, velocity, management, processing, granularity, security, veracity, and more.
- Technology is shifting data from infrequent, small-samples to routine, frequent population reflective data.
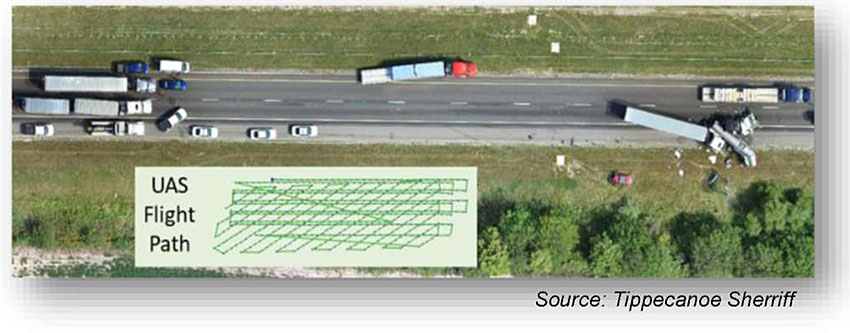
Author’s Slide 12 meeting notes below:
Key Message: There are many new sources of data. What has spurred this data tsunami is the availability of low-cost communications and sensors offers new opportunities to collect, analyze, and use emerging technology data. Of note, most emerging technology data is being collected for the purpose of profiling individuals for marketing services by commercial entities. Thus, the data at the point of collection may be personally identifiable but is aggregated and offered to transportation agencies. The ’recipe’ used for the data is kept a secret.
For Example, Replica - which began with Sidewalk Labs inside Google about 4 years ago is now a company that provides weekly, seasonal and historic Origin-Destination activity-based trends. They build a synthetic population based on census data, and apply activities to individuals in an anonymized fashion using cellular, vehicle, dash GPS, POI aggregates, consumer and resident data (e.g., Zillow and Yelp), land use and real estate data, credit transaction data around POS (point of sale ~200M or 70% of the population per month), and ground truth data (public or private data).
For Example, HERE - has LiDAR data for major interstates and great portions of arterial roads in the US to support map/navigation products to auto manufacturers. They could use this data for precise image extraction of road infrastructure and even state of repair (e.g., guardrails). The business case; however, is not sufficiently clear for them to invest in this and potentially other product offerings.
Slide 13:
Crowdsourced Data
“Crowdsourcing is the practice of addressing a need or problem by enlisting the services of a large number of people via technologies.”
- FHWA EDC-5 Crowdsourcing Orientation Webinar, Sep 2018
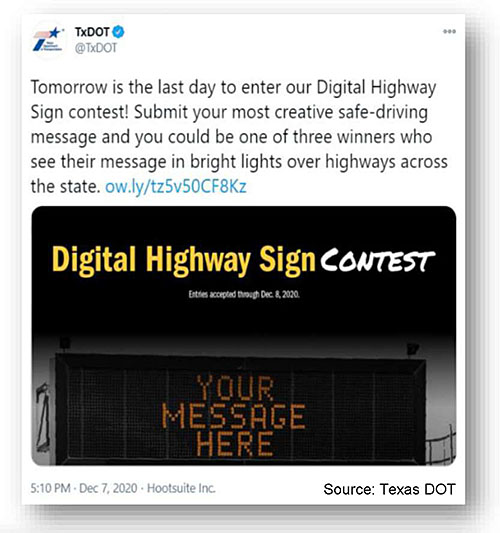
Includes data from:
- Vehicle probes
- Mobile apps
- Social media
- Connected vehicle
- Public engagement
Author’s Slide 13 meeting notes below:
Key message: One recently emerged data is crowdsourced data, broadly defined as leveraging the crowd to address a need via technology. The FHWA Every Day Counts Crowdsourcing for Advancing Operations initiative broadly interprets crowdsourced data to include five general data types.
Vehicle probe - vendor provided, typically uses a mix of GPS, cellular geolocation, connected vehicle, and ITS sensor data. Vendors include INRIX, HERE, TomTom, Google, and Verizon to name a few.
Mobile apps - 511 apps that collect user input, 311 apps, Waze for Cities, and more specialized apps (e.g., Utah Citizen Reporter app)
Social Media - Mainly Twitter, but also Facebook.
Connected Vehicle - data is now being offered by Verizon, Wejo, Ford Mobility and a few other entities - most as archived raw data or archived data analytics.
Slide 14:
Slide 15:
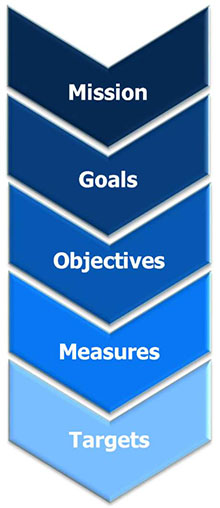
Performance Management
Provides a framework to:
- Set realistic performance goals
- Focus on the most important challenges
- Improve efficiency
The framework should map mission to goals, objectives, performance measures, and targets.
Without this framework, agencies can become overwhelmed with data, complex analytics, and too many performance measures, some even conflicting.
Author’s Slide 15 meeting notes below:
Key Message: With ever-increasing volumes of new data, and new vendors and analytics providers offering new capabilities, agencies may be tempted to acquire data without a compelling business need, and in the process spend funds and time without a return on investment. Begin with clarifying the Agency or Business Line mission, goals, and objectives. Then define specific measures and data-capabilities that address the defined objective.
Slide 16:
Fundamentals: Understanding Your Data
Data quality is a measure of the degree to which data meets the purpose of intended use by systems, processes, and people.
Agencies must remain vigilant across every facet of data quality. Critical facets include:
- Accuracy
- Consistency
- Completeness
- Uniqueness
- Timeliness
- Validity
When organizations deliver reports, dashboard statistics, and decision support without first exploring the data, the resultant information can lead to poor decisions.
“Garbage in Garbage Out” is exacerbated when working with Big Data and “Black Box” analytics.
Author’s Slide 16 meeting notes below:
Key Message: Often in the simplification of data through reports and dashboards obfuscates the provenance of data and with it the quality of the data. For example, understanding whether the data is of sufficient quality for a roadway or region will help agencies know whether to act on the data. Quality should be linked with intended use. For example, the quality of a linear referencing system may suffice for assets but be lacking for integration and use in real-time incident management to understand location and direction of a roadway crash.
- Accuracy - degree to which data correctly reflects the real world object OR an event being described.
- Consistency - Consistency means data across all systems reflects the same information and are in synch with each other across the enterprise. Examples:
- A business unit status is closed but there are sales for that business unit.
- Employee status is terminated but pay status is active.
- Completeness How comprehensive is the information? - For example, a customer’s first name and last name are mandatory but middle name is optional; so a record can be considered complete even if a middle name is not available.
- Reliability Does the information contradict other trusted resources?
- Relevance Do you really need this information?
- Timeliness How up- to-date is information? Can it be used for real-time reporting? Timeliness references whether information is available when it is expected and needed. Timeliness of data is very important.
Slide 17:
Traditional v. Real-Time Analytics
| Traditional Analytics |
Real Time Analytics |
Traditional analytics -
- Typically, numerical data to infer population characteristics from a sample
- Well-defined schema, minimal change in terms of data fields
|
Real-time analytics -
- May be numerical, text, geocoded, image, video, or other data
- Triggers and metrics for monitoring and notifications to improve decision-making timeliness and efficiency
|
| Common tools - Spreadsheets (Excel), Traditional relational database (Access, Oracle, SQL), some specialized software |
Common tools - Cost-effective using cloud services such as Apache Kafka, Apache Storm, AWS Kinesis, Google Cloud Dataflow, and Microsoft Azure Stream Analytics |
| Common techniques for traditional and real-time analytics include classification or clustering, graph analytics, video/image analysis, and artificial intelligence. Technique execution has improved with Big Data, new computational strategies, and the power of cloud computing. |
Author’s Slide 17 meeting notes below:
Key Message: The analytical methods from 50 years ago are the same as today for most uses. With Big Data, the execution of the analytical strategy must change to approximate and come to a close enough answer. To support real-time analytics in a cost-effective manner will require cloud services and cloud-based tools.
Traditional relational databases, which are costly to evolve for real-time analyses because of the inherent need for high availability and low processing times for real-time information. The storage and computing capabilities available using cloud infrastructure can support very complex real-time data analysis over very large datasets with millisecond, even microsecond, updates.
Slide 18:
Analytics Trends and Terminology
Trends
- Analytics on the edge
- Democratization of data
- Velocity of obsolescence
- Maturation of AI in a box
Terminology
- Artificial intelligence
- Machine learning
- Role of supervision
- Deep learning
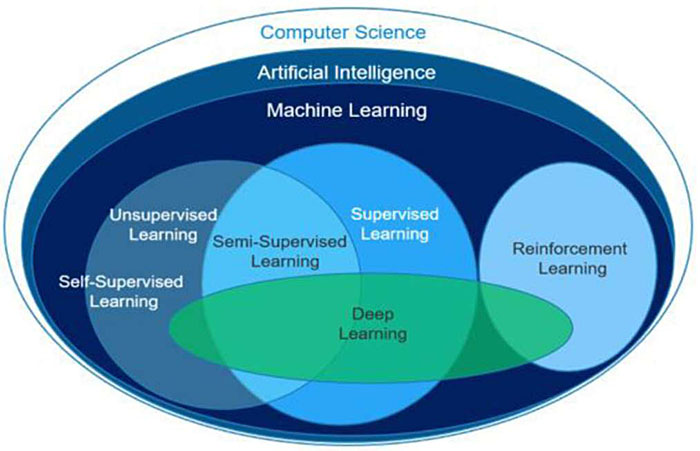
Source: Vlad Mysla
If your data is bad or small, your machine learning tools are likely useless.
Author’s Slide 18 meeting notes below:
Key Messages:
- There are four key trends in analytics:
- Analytics on the edge - microprocessors have reached an advancement where the analytics are performed at the device level, and the key data transmitted are the results. For example, video analytics performed at the edge device does not save the video, but does transmit pedestrian, bicycle, auto, truck counts.
- Democratization of data - greater transparency and accessibility of data and analytics on demand. Allows those without expertise to conduct analytics - this is a double edge sword if the analyst does not understand the nature and quality of the data they are accessing.
- Velocity of obsolescence - Obsolescence is defined by the time when a technical product or service is no longer needed or wanted even though it could still be in working order. Obsolescence relates to hardware, software, and human skills with compliance, security vulnerability, flexibility, silo, and resource support implications. Cloud service use is one way to cope with obsolescence. Using/supporting an open source/open standard community is a second way to cope with obsolescence.
- AI in a box - The good news is that many AI techniques are available as a tools. The bad news is that more and more are proprietary, and the models developed based on the technique may be difficult to “explain.”
- Most transportation data is not Big Data. The transportation data that is Big Data may not yet be of sufficient fidelity to support AI and ML.
- Unsupervised Learning lets the computer recognize patterns on its own with a minimum or no human supervision, typically using clustering techniques.
- Supervised learning uses part of the already classified data to train the model, and another part to test the model.
- Reinforced learning is where the system uses outcomes to modify the model/strategy. A simple example of reinforced learning may be a self-navigating vacuum cleaner.
- Deep learning typically reflect neural networks with representation learning - Neural networks have been used on a variety of tasks, including computer vision, speech recognition, social network filtering, and medical diagnosis.
Slide 19:
Slide 20:
Data Governance - Traditional v. Modern
- Data governance is the exercise of authority, control, and shared decision making over the management of data assets.
- Traditionally, has been closely associated with managing legal risk, regulatory compliance, and security by IT departments
- Modern governance needs to encompass the entire data supply chain rather than mandate data structures and data tools for business units
- According to the Data Governance Institute, eight principles are central to successful data governance and stewardship programs:
- Integrity
- Transparency
- Auditability
- Accountability
- Stewardship
- Checks and Balances
- Standardization
- Change Management
Author’s Slide 20 meeting notes below:
Key Message: Data governance is critical to ensuring access to good, sufficiently secure data and tools.
Data Governance is more rapidly evolving for ITS groups compared to other business units. Some agencies’ operations and ITS groups find themselves requiring greater autonomy in data governance.
- For example, most connected vehicle pilot projects funded through the USDOT followed well-defined data management practices. They did so, however, within the project and often through outsourced contractor support housed in its own data governance bubble. The state or local agency did not merge or change their data governance or management practices to incorporate the new real-time data. Instead, the broader agency followed the traditional systems engineering and IT management approach, waiting for the conclusion of the pilot before data integration.
Agencies are beginning to exercise ‘modern’ data governance at the project or program level, but not at the agency level.
Slide 21:
Data Management - Traditional v. Modern
- Data management is the practice of collecting, keeping, sharing, and using data securely, efficiently, and cost-effectively.
- Developed last century to support consistent, routine reporting using relational database systems, through fully define requirements
- Modern data management is intended to support change - in data types, access, analytics, software, and processes
- DAMA, the global non-profit association, identifies eleven knowledge areas in their “Data Management Body of Knowledge:”
- Metadata
- Quality
- Architecture
- Security
- Storage and operations
- Modeling and design
- Document and content management
- Integration and operability
- Reference and master data
- Warehousing and business intelligence
Author’s Slide 21 meeting notes below:
Traditional data management was developed to support consistent, routine reporting functions using relational database systems, through fully define requirements. Modern data management is intended to support change. Modern data management is a must to efficiently access and apply big data for decision making.
Slide 22:
Slide 23:
ITS and Newer Data Opportunity & Challenge
- ITS and newer data can improve operations, investment, planning, and human capital decisions at every level of decision making
- AI applications hold promise for improved decision making, presently in the areas of video and image analytics
- Shifting from manual ad-hoc to real-time analytics offers more immediate value for transportation decision making
- Rely on the guideposts of performance management, and modern data management and governance, to achieve improved decision making and avoid unnecessary or unwise investments in data and analytics
Author’s Slide 23 meeting notes below:
Key message: ITS and newer data are useful at all levels of decision making across business lines. To make use of this data will require transformations in data management and governance, in skill sets, and strong adherence to performance management.
Slide 24:
Questions?
- What types of transportation agency decisions benefit from data?
- What are some emerging data sources and how do they differ from traditional ITS data?
- What is the difference between traditional and modern data management?
- What will help agencies choose high-value relevant data and analytics to improve decision making?
Author’s Slide 24 meeting notes below:
- Nearly transportation agency decision can benefit from data - from front-line operator decisions to enterprise-wide decisions, from operations and planning to asset management and investment prioritization.
- Emerging data sources include Transportation network companies (TNC) and micromobility data, Connected vehicle, traveler, and infrastructure data, and Internet of Everything (IoE) data, unmanned aircraft systems data, crowdsourced data and more. The differ in the volume, variety, velocity, management, processing, granularity, security, veracity, and more.
- Traditional data management was designed to support consistent, routine analysis and reporting using relational database systems, through fully define requirements. Modern data management is intended to support change - in data types, access, analytics, software, and processes.
- The guideposts of performance management, and modern data management and governance, will help agencies achieve improved decision making and avoid unwise investments in data and analytics.
Slide 25:
Resources: Guidance, Research, Case Studies
Slide 26:
Resources: Guidance, Research, Case Studies
Slide 27:
Resources: Guidance, Research, Case Studies
Slide 28:
Resources -
Webinars, Briefings, and Web Tools
- Webinars, Videos, and Briefings
- Transportation Data Analytics - Web Examples
Slide 29:
Resources - Websites
Slide 30:
Thank you & Questions?

Vaishali Shah
Senior Program Director
Transportation Systems
AEM Corporation, Herndon, VA, USA
Vaishali.Shah@aemcorp.com
Slide 31:
Knowledge Check
How do emerging data differ from traditional ITS data?
- Volume
- Variety
- Velocity
- Veracity
- Management
- Processing
- Granularity
- Security
Return to top ↑