← Back to Module 5
ITS ePrimer Presentation
Module 5: ITS to Support Travelers
Slide 1:

ITS ePrimer
Module 5: ITS to Support Travelers
ITS Professional Capacity Building Program
ITS Joint Program Office
U.S. Department of Transportation

Author’s Slide 1 meeting notes below:
This module is sponsored by the U.S. Department of Transportation’s ITS Professional Capacity Building (PCB) Program. The ITS PCB Program is in the ITS Joint Program Office (ITS JPO), within the Office of the Assistant Secretary for Research and Technology (OST-R).
Thank you for participating and we hope you find this module helpful.
Slide 2:
Instructor
Alex Skabardonis
Professor
University of California, Berkeley
Berkeley, CA, USA
Slide 3:
Learning Objectives
- Learn the capabilities, features, and limitations, of ITS technologies for multimodal transportation
- Understand deployment opportunities and constraints for ITS technologies for all travelers
- Understand emerging and future trends in ITS technologies for all travelers
Author’s Slide 3 meeting notes below:
ITS technologies offer an array of applications and enhancements for multimodal transportation; from real time information to safety applications and driver conveniences. This updated module explores current and emerging applications that enhance traveler experience and safety.
Slide 4:
Outline
- Traveler Information
- Parking Information
- Mobility on Demand
- Mobility as a Service (MaaS)
- Driver Assistance Systems
- Traveler Comfort and Convenience
- Personal Rapid Transit
- Urban Aerial Mobility
- Connected and Automated Vehicles
Author’s Slide 4 meeting notes below:
ITS systems and impacts:
Real-time travel information on mode, routing, arrival time, parking
Aggregation and integration of public and private modes and services
Drivers assistance systems to improve safety, comfort and convenience
Emerging transport modes: personal rapid transit and aerial vehicles
Emerging technologies: connectivity and automation
Slide 5:
Real Time Travel Information
Information types and impacts
Pre-Trip
- Trip departure time
- Mode of travel
- Route choice
En-Route
- Change route
- Change mode (if alternate mode with parking available)
- Expected arrival times
Author’s Slide 5 meeting notes below:
- Travel information can be pre-trip and/or en-route
- Here shown the key impacts under each category
- Note that options depend on the availability of alternate modes and routes
Slide 6:
Real Time Travel Information
Dissemination (1)
World Wide Web
- Every state DOT offers traveler information website
- Pre-trip information
- Wide geographic area coverage
- Images from CCTV cameras on real-time conditions
511 Phone System
- Over 46 511 systems (include websites)
- Highest usage under major events
- Extreme weather
- Major road closures
Author’s Slide 6 meeting notes below:
- The Internet World Wide Web is the predominant form of traveler information
- 511 systems provide free phone service
- 511 include websites that can be customized for individual trips (Bay Area 511)
Slide 7:
Real Time Travel Information
Dissemination (2)
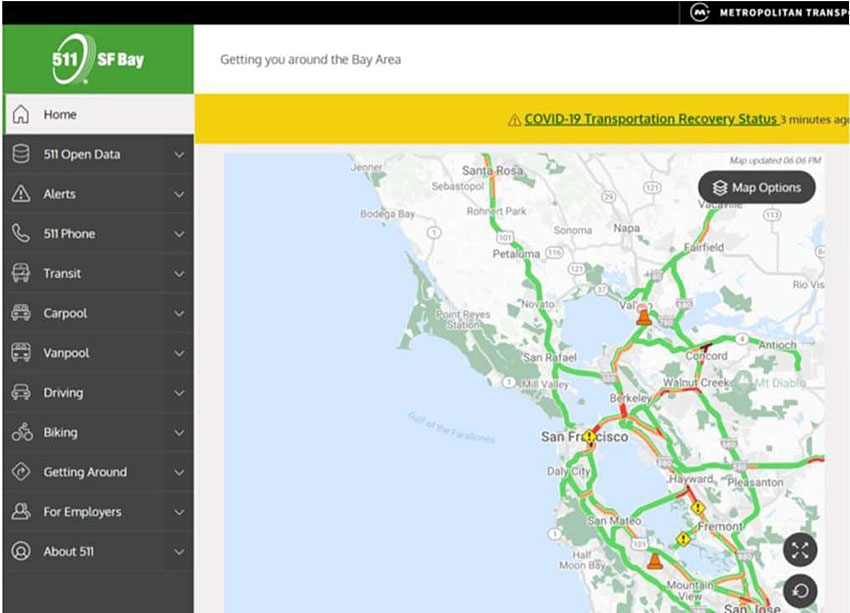
San Francisco Bay Area 511
https://511.org
Author’s Slide 7 meeting notes below:
- San Francisco Bay Area 511 Website screen shot
- Color coded speed maps
- Includes Transit Information
Slide 8:
Real Time Travel Information
Dissemination (3)
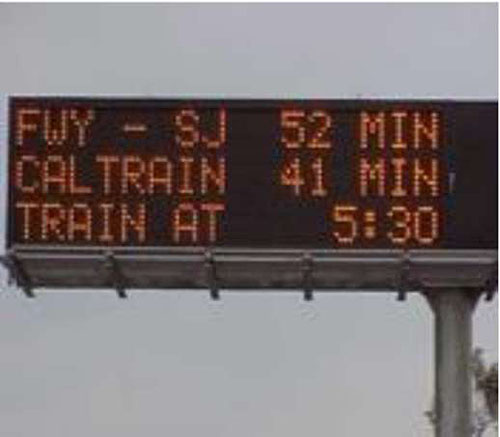
Variable Message Signs (VMS)
- Expected travel times to destinations
- Alerts on incidents, inclement weather, other events
- Location important (prior to decision point)
- Emergency Messages
- AMBER alert
- LEO alert
- SILVER alert
VMS Implementation in Michigan DOT
https://www.youtube.com/watch?v=tUNgPSx0rxk
Author’s Slide 8 meeting notes below:
- VMS signs are implemented on most urban freeways
- Typically located prior to major interchanges (for choosing alternate routes)
- Compliance to messages depends on information accuracy from past experience
- Shown a VMS in the San Francisco Bay Area Link to video on VMS usage (West Michigan TMC)
Slide 9:
Real Time Travel Information
Dissemination (4)
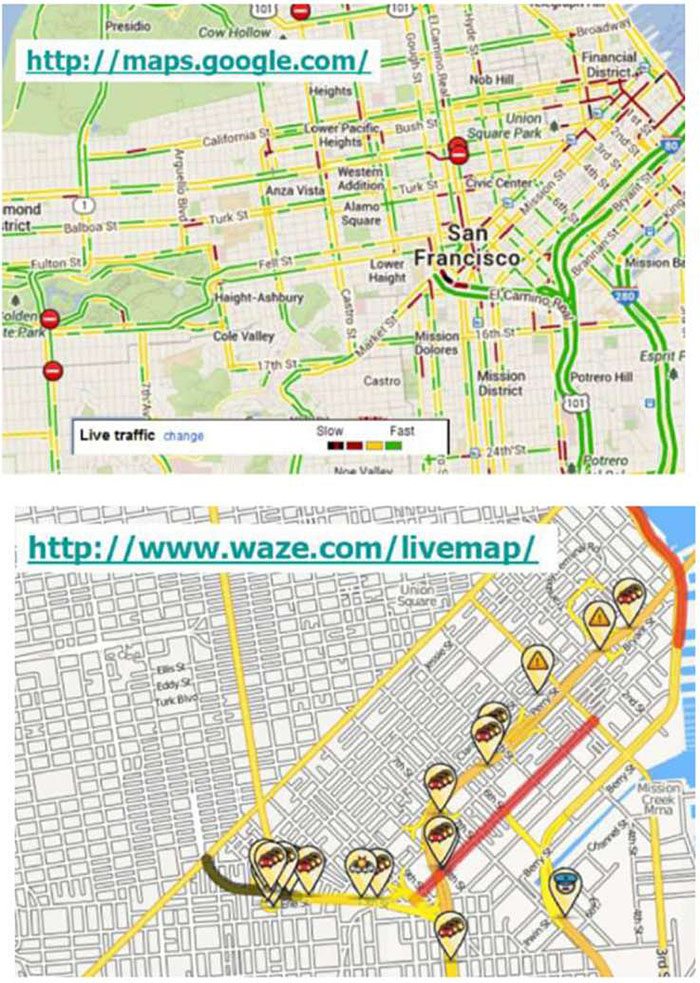
- Mobile applications and social networking
- Handheld devices
- In-vehicle navigation systems
- Email/text
- TV/Radio
- Highway Advisory Radio (HAR)
Author’s Slide 9 meeting notes below:
- Predominant use of mobile apps and social networking signs
- Screen shots of two apps
- TV/radio and HAR mostly utilized in disadvantaged areas
Slide 10:
Real Time Travel Information
Benefits
Improve Traveler Decision Making
- Make accurate and timely decisions
- Routing
- Time of departure
- Mode
- Not make the trip
- Sense of ‘self-control’ to traveler
Reduce Frustration and Irrational Behavior
- Improve perceived level of service
Author’s Slide 10 meeting notes below:
Benefits to individual drivers
- Depend on the availability of routes, modes for the particular trip
- Depend on the flexibility of departure time
- Drivers value more travel time reliability information, especially under incident conditions
Slide 11:
Real Time Travel Information
Benefits
Spread or Reduce Peak Traffic Demand
- Over space: alternative routes
- Over time
- Alternative modes
- Eliminating discretionary trips
Field Evaluation Results
- Traveler information users perceive time savings
- In-vehicle travel time savings are small
Author’s Slide 11 meeting notes below:
Transportation system benefits due to traveler information
- Note that the best route for the traveler may not be the best for the system
- Highest benefits under non-recurrent congestion
- All field tests show that travelers perceive time savings from traveler information systems
- Independent measurements of travel times show small savings
Slide 12:
Real Time Travel Information
Data Sources (1)
- Fixed sensors approximately 0.5 mile apart in each travel lane (e.g., loops, radar, video)
- Event information from incident management teams, police patrols
- CCTV
- Probe vehicles
- ETC transponders
- Cell phones
- Bluetooth readers
Author’s Slide 12 meeting notes below:
- Data from fixed sensors are typically collected every 20-30 sec and aggregated every 5 minutes
- Sensor failures create data errors and gaps
- Information from mobile sources can fill gaps and provide information for highway links without fixed sensors through data processing and fusion
- CCTV cameras are the primary source for incident verification
Slide 13:
Real Time Travel Information
Data Sources (2)
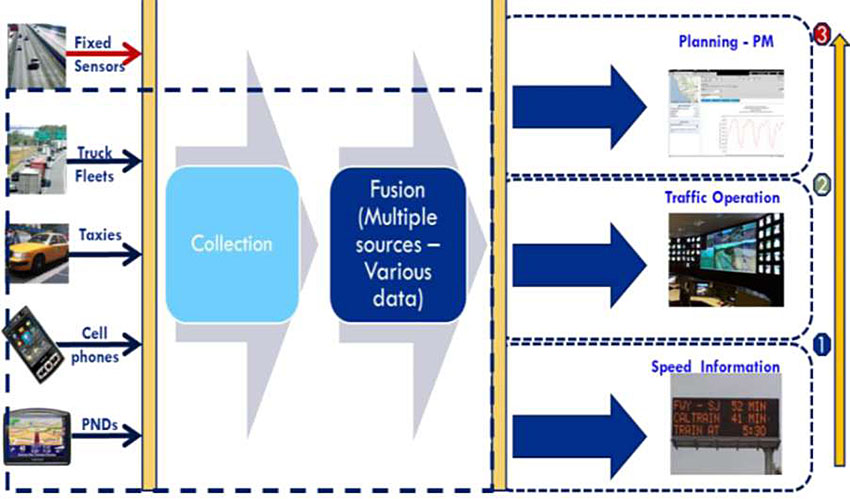
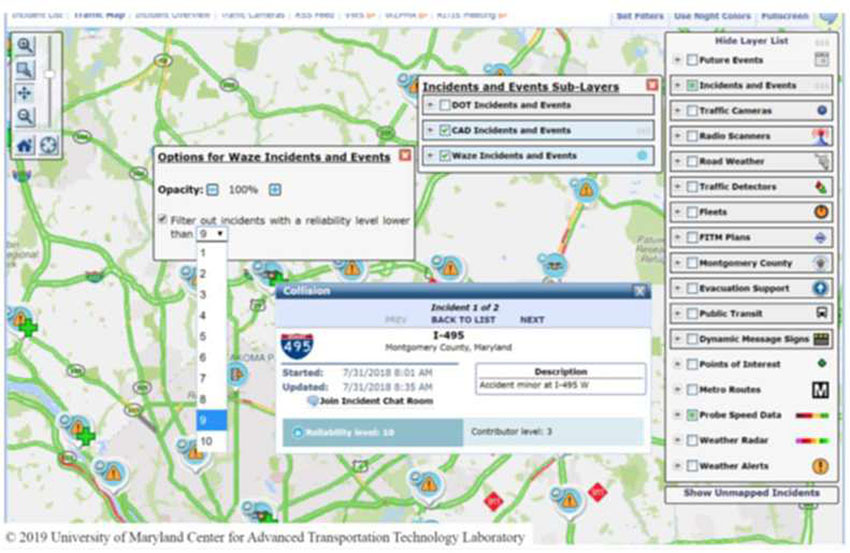
Data Fusion from Multiple Sources improves coverage and accuracy Crowdsourced data integrated with TMC data
Author’s Slide 13 meeting notes below:
Illustration of data collection from multiple sources, data processing, and fusion and possible data uses including transportation planning (trends in volumes), traffic operations (control, incident management) and traveler information
Crowdsourced data can be integrated with TMC detector data to improve the accuracy of the incident detection algorithms (RITIS system and Waze Data Integration)
Slide 14:
Real Time Travel Information
Transit
Dissemination
- Web
- Mobile Applications
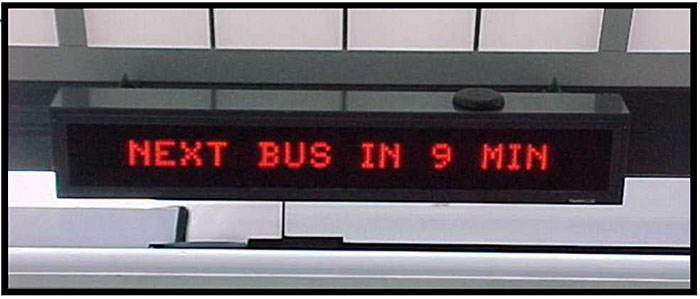
- Station/Transit Stop Displays
- In-Vehicle Displays
Content
- Maps/schedules
- Expected arrivals real-time
- Transit vehicle tracking (AVL)
- On-line Trip Planner
Author’s Slide 14 meeting notes below:
- Most transit systems provide websites with maps, schedules and expected arrival times
- Websites linked or part of the 511 websites
- Station information of arrival times through audio/displays
- Data
- The Google Transit and the General Transit Feed Specification (GTFS)
- Open source platform: Open Trip Planner
Slide 15:
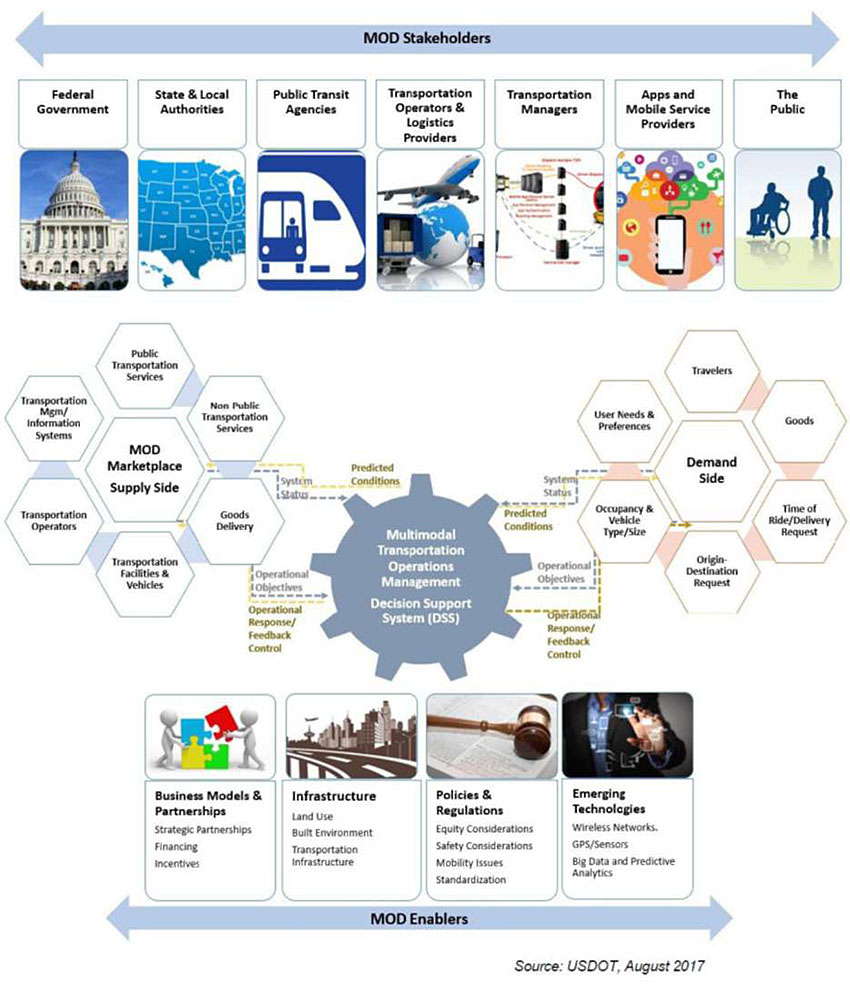
Mobility on Demand (MOD)
- MOD vision for safe, reliable travel for all users
- MOD enables consumers to access mobility, goods, and services on demand by using shared mobility, delivery services, and public transportation solutions through an integrated and connected multimodal network
Author’s Slide 15 meeting notes below:
MOD is a multimodal program to study emerging mobility services, public transportation networks and operations, and goods delivery services.
MOD is based on the principle that transportation is a commodity where modes have economic values that are distinguishable in terms of cost, journey time, wait time, number of connections, convenience, and other attributes.
FHWA, “Mobility on Demand: Operational Concept Report,” Report FHWA-JPO-18-611, Washington DC, September 2017.
Slide 16:
Mobility as a Service (MaaS)
- Mobility aggregation and submission services
- Access to several transportation modes
Transportation Network Companies (TNC)
- Offer on-demand rides by private vehicles
- Short trips in dense areas during off-peak periods
Alternative Transit Services
- Paratransit, microtransit on demand transit
- Partnerships with TNC
- First & last mile, on call-and ride
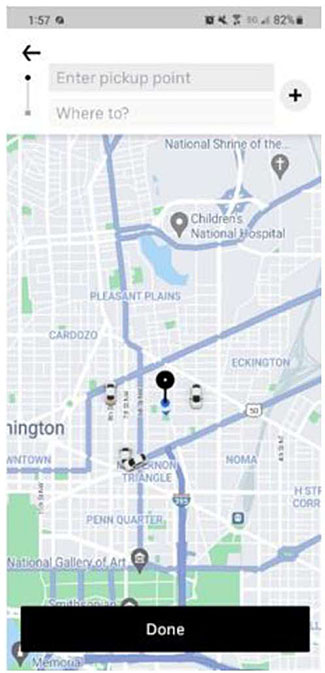
Author’s Slide 16 meeting notes below:
Screenshots of smart phone applications for companies offering on demand rides
Efforts underway to develop GTFS-Flex as a data standard for on-demand services that may be operated by a transit agency or TNC.
Slide 17:
Mobility as a Service (MaaS)
Carsharing
- Car availability without car ownership
- Designed for occasional car users
- Provided by private companies through membership
- Benefits
- Reduction in auto ownership, VMT
- Reduction in fuel consumption/emissions
Bikesharing
- Bikesharing systems integrated into existing transportation systems
- Bicycle stations often at transit hubs
- Complete street designs improve bicycle travel and safety
Author’s Slide 17 meeting notes below:
- There are 1.5 million vehicles and more than 15,000 available in the United States. (2018)
- Web-based or smart phone applications permit the reservation of vehicles at selected locations, choice of vehicles (gasoline or electric), parking at destination, payment, and other transactions.
The availability of one-way trips provides a first-mile and last-mile access to transit stops
There are more than 30 million bikesharing users in the United States. Bikesharing systems increased mobility, increased flexibility, low implementation and operational costs, increased health benefits, and greater environmental awareness.
Slide 18:
Parking Information
Public Agencies/Operators
- Maps with Parking Facilities
- Information on the Web: location, space availability
Private Service Providers
Web / Mobile Applications
- Real-time Parking Availability
- Online Reservation/Payment
Advanced Systems (SF, DC)
- Real-time data on parking occupancy
- Parking pricing set to maximize utilization
- Information on Web and smartphones
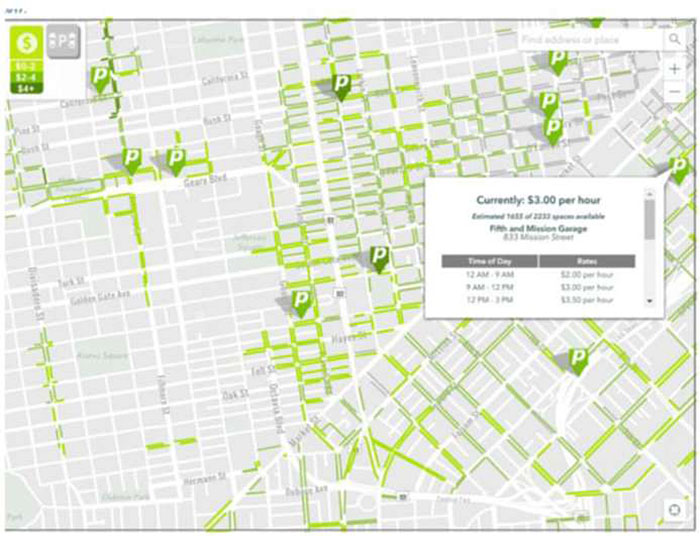
San Francisco parking
Author’s Slide 18 meeting notes below:
- Deployment of wireless sensing enables accurate information on parking availability
- Parking pricing schemes try to maximize utilization and minimize block circling
- Typical max occupancy 85 percent
Slide 19:
Parking Information
Multimodal Information
- Driving Times
- Parking Availability at Transit Stations
- Transit Information
- Influences Mode Choice
- Travel Time Savings
- Perceived Congestion
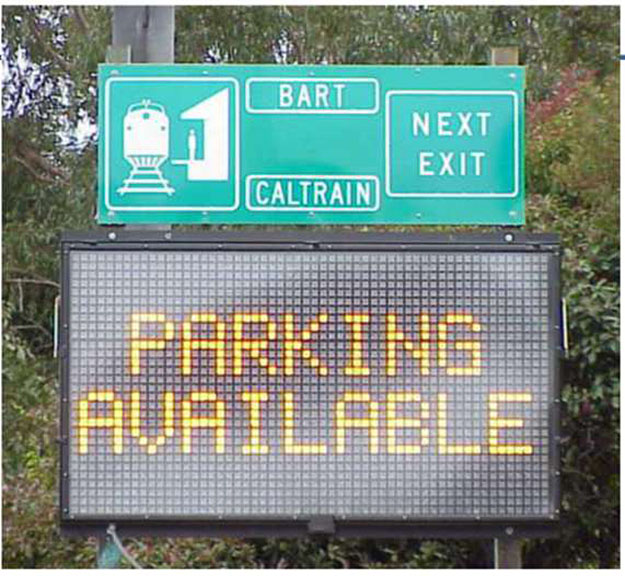
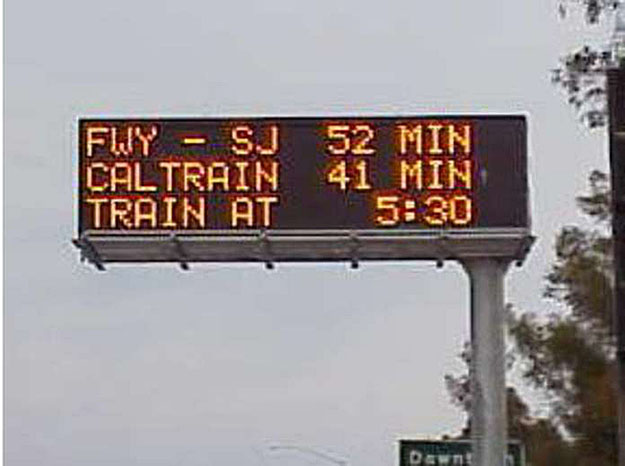
Author’s Slide 19 meeting notes below:
- Field tests show that drivers can park and ride transit if the expected travel time is shorter than drive time
- 8 percent of drivers switched modes when the time savings were greater than 20 minutes
- Source:
Mortazavi, A. et. al, “Evaluation of Displaying Transit Information on Changeable Message Signs,” Research Report UCB-ITS-CWP-2009-2, University of California Berkeley, September 2009.
Slide 20:
Driver Assistance Systems
- Intersection Collision Warning Systems (CWS)
- Pedestrian Automatic Emergency Breaking Systems
- Lane Departure Warning System
- In Vehicle Vision Enhancements
- Blind-Spot Detection Information Systems (BLIS)
- Wrong Way Driving Warning
- Forward Collision Warning (FCM) Systems
- Rollover Warning Systems
- Driver Impairment Monitoring
- Adaptive Cruise Control (ACC)
Adjust speed to maintain preset headway (minimum 1 min)
Advanced Driver Assistance System https://www.youtube.com/watch?v=5vuKvW 5QVM
Author’s Slide 20 meeting notes below:
- These systems designed for improving safety
- Developed mostly by auto manufacturers
- Some systems for busses and commercial vehicles developed under the USDOT Integrated Vehicle-Based safety System (IVBSS)
Slide 21:
Traveler Comfort and Convenience
In-Vehicle Navigation and Route Guidance Systems
- GPS based
- Turn-by-turn directions
- May include real time traffic information
- Additional Information (Parking, Yellow Pages)
- Autonomous or through Subscription
Transit Fare Payment Systems
- Smart Cards for multiple transit lines/agencies
- Mobile Phones
- Mobility Payment Integration (MPI): Shared payment media transit + mobility providers (TNCs, bikeshare, microtransit)
Author’s Slide 21 meeting notes below:
- Systems designed to ease the travel experience
- Most of the basic functions of in-vehicle systems are available on smartphones
- Transit payment systems for multiple agencies with complicated fare structures take considerable time to implement due to technical and institutional constraints
As of 2018, 34 locations around the country had deployed automated fare collection (AFC) in their transit systems. Eighteen of these systems are implementing mobility payment integration (MPI) systems to incorporate shared payment media across transit agencies and mobility providers (bikeshare, TNCs, and microtransit).
USDOT Volpe National Transportation Systems Center, “Mobility Payment Integration: State of the Practice Scan,” FTA Report No 0143, October 2019.
Slide 22:
Traveler Comfort and Convenience
Electronic Toll Collection (ETC)
- Toll paid though transponders without stopping
- ETC increases toll lane capacity four times
- ETC transponders may operate across States/facilities
- ETC mandatory for congestion pricing implementation
- Open Road Tolling (ORT): toll collection at highway speeds
- Higher capacity
- Improved safety
- Reduced fuel and emissions
Author’s Slide 22 meeting notes below:
- Drivers without transponders are billed based on license-plate recognition technology
- Open road tolling (ORT) does not utilize toll booths
- ORT reduce accidents by 24-60 percent based on field studies
- Increasingly tolled facilities are converted to only ETC/ORT
Slide 23:
Personal Rapid Transit (PRT)
Alternative to Conventional Transit in Low-Density Areas
- Small driverless vehicles (up to 15 passengers)
- Dedicated tracks/offline stations
- High capacity (2-second headways)
- Point-to-Point service/passenger comfort
Feasibility Studies
- “Last Mile” solution for transit systems
- Major employment centers/business parks
- San Jose International Airport-ground access
Author’s Slide 23 meeting notes below:
Concept originated in late 1950s with numerous designs in late 1960s and early 1970s
Morgantown at West Virginia University system has been implemented and is in continuous operation since 1975 with 99 percent reliability
- Capacity (min headway) is constrained by requirement to avoid collision under all cases (brick-wall)
- Typical speeds of 30 mph (reported speeds up to 150 mph)
- Recent implementations of PRT
- Short distances, small (personalized) vehicles
- Average waiting time 10 sec (ULTRA system)
Slide 24:
Personal Rapid Transit (PRT)
Recent Implementations
- ULTRA Heathrow Airport (2.4 miles, 21 vehicles)
- 2getthere Abu Dhabi (1.1 mile, 13 vehicles)
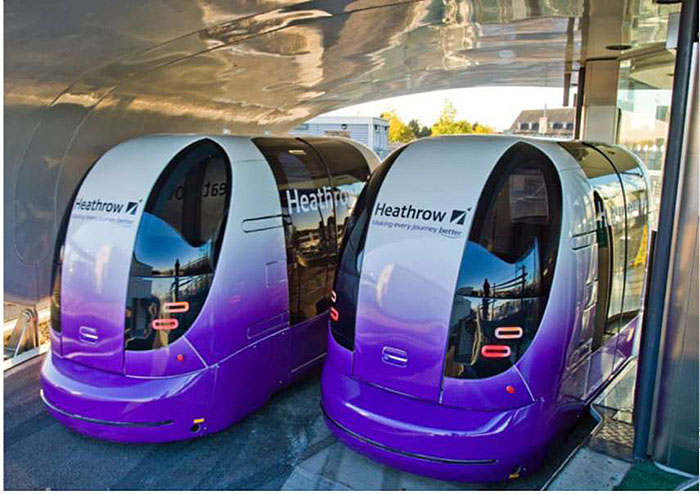
ULTRA PRT system http://www.ultraglobalprt.com/
Author’s Slide 24 meeting notes below:
Sources:
Overview of PRT systems and links to PRT websites. Maintained by J. B. Schneider.
http://faculty.washington.edu/jbs/itrans/prtquick.htm
Cottrell W.D. and O. Mikosza, “New-Generation Personal Rapid Transit Technologies: Overview and Comparison,” Transportation Research Record, Journal of the Transportation Research Board, No. 2042, Washington DC, 2008, pp. 101-108.
Slide 25:
Urban Aerial Mobility
Unmanned Aerial Vehicles (UAV) Commercial Applications
- Package Delivery
- Mapping and Surveying
- Infrastructure Inspections
- Surveillance
Passenger Transport
- VTOL airplanes
- “Flying Taxis”
Author’s Slide 25 meeting notes below:
The commercial UAV U.S. market expected to grow to about $13.6B by 2025.
Safe and cost-efficient passenger carrying UAVs for the public appear to be into the future subject to market, land use, and regulations.
Potential scenarios:
Short-term passenger transport VTOL (vertical take-off and landing) aircraft service along specific “air routes”
Longer term VSTOL aircraft serving hub operations
Air Taxi service further into the future
Cohen A.P., S. Shaheen, E.M. Farrar, “Urban Air Mobility: History, Ecosystem, Market Potential and Challenges,” IEEE Transactions on Intelligent Transportation Systems, Volume 22 (9), September 2021
Slide 26:
Vehicles, Internet, Phone and the Future
Cooperative Vehicle-
Infrastructure Systems
Vehicle-to vehicle (V2V)
- Communications
- Cooperative Adaptive Cruise Control (CACC)
- Active Safety Systems
- Reduce crashes by 80 percent
- Driver Alerts (Queue Warning)
Author’s Slide 26 meeting notes below:
Communications media
Dedicated Short range Communications (DSRC) and cellular networks depending on the applications
- Minimal exchange of information: location, heading, speed
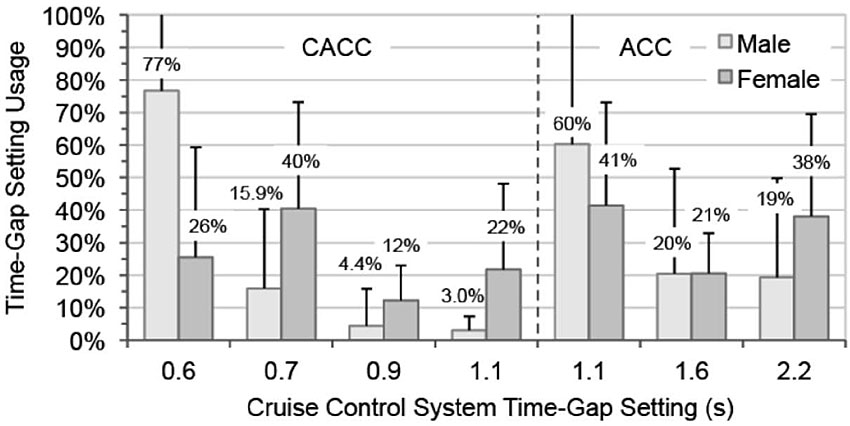
CACC: Field tests shown that drivers comfortable in accepting shorter gaps from 1.5 sec under ACC to 0.7 sec under CACC
Shorter gaps increase freeway capacity, from 2,000 veh/hr/lane to 3600 veh/hr/lane subject to vehicle penetration
Nowakowski, C., et al. Cooperative Adaptive Cruise Control: Testing Drivers’ Choices of Following Distances. California PATH Research Report for FHWA Exploratory Advanced Research Program Cooperative Agreement DTFH61-07-H-00038. January 2011.
Slide 27:
Vehicles, Internet, Phone, and the Future
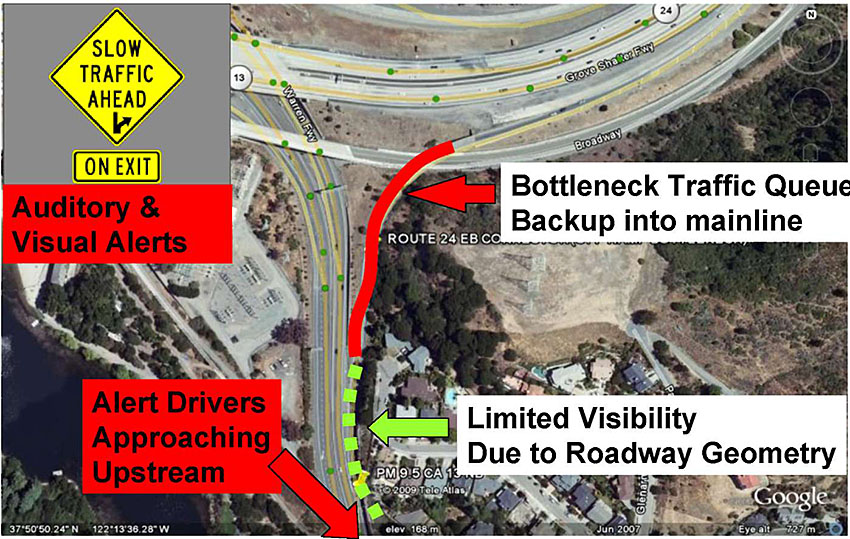
Connected Vehicles (V2V)--Queue Warning
Author’s Slide 27 meeting notes below:
Illustration of Queue Warning under Connected Vehicles V2V Communications Source:
Nowakowski, C., et al., “SafeTrip 21 Initiative: Networked Traveler Foresighted Driving Field Experiment Final Report,” Research Report UCB-ITS-PRR-2011-05, University of California Berkeley, June 2011
Slide 28:
Vehicles, Internet, Phone and the Future
Cooperative Vehicle-Infrastructure Systems
Vehicle-to Infrastructure (V2I)
- SPaT Message
- Applications
- Safety
- Mobility
- Improved traffic signal control
- Dynamic route advisory
- Environment
- Speed advisory for minimum fuel/emissions
Author’s Slide 28 meeting notes below:
V2I: Ability to wirelessly exchange information about vehicles (position, speed) and infrastructure
Example: Status of the traffic light: Signal phase and timing (SPaT) Applications:
Yellow extension to avoid red light running
Adaptive control of signal settings (green times and offsets) to minimize delay based on real-time demands and O-D patterns
Given signal status and road characteristics calculate vehicle speed to minimize fuel consumption and emissions
Slide 29:
Vehicles, Internet, Phone, and the Future
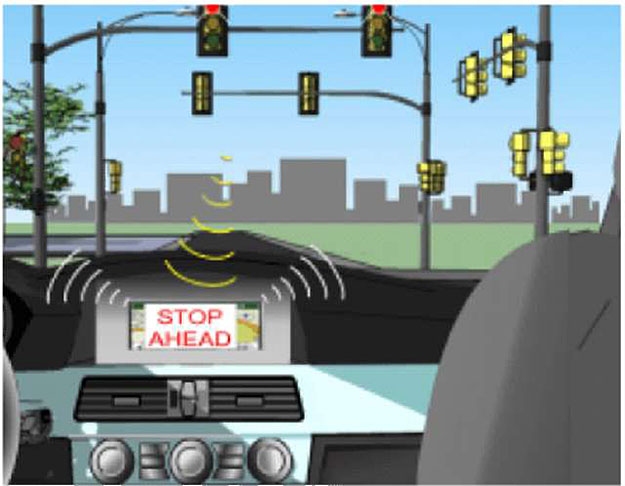
Vehicle-to Infrastructure (V2I)
Dynamic Speed Advisory (Source: BMW)
SPaT message transmitted to the vehicle
Signal status and recommended speed on driver speedometer
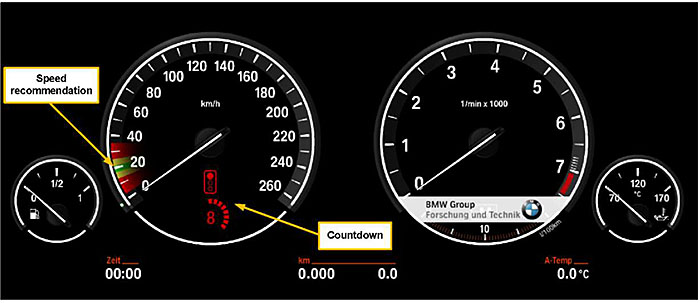
Author’s Slide 29 meeting notes below:
Sources:
ITS JPO Connected vehicle initiative:
https://www.its.dot.gov/pilots/cv_pilot_apps.htm
BMW of North America, “Advanced Traffic Signal Control,” Final Report, prepared for the FHWA Exploratory Advanced Research Project, July 2012.
Slide 30:
Automated Vehicles (AV)
Levels of Automation
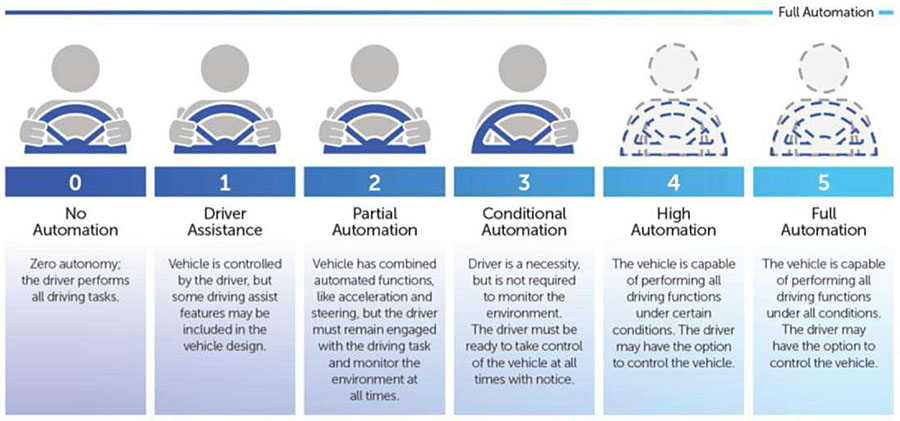
- More than 30 private companies developing AV technology
- Emphasis on Level 4
- Waymo is the only automated private vehicle in operation
- Nuro is an AV mini car for package deliveries in neighborhoods
Author’s Slide 30 meeting notes below:
SAE Levels of automation
0: no automation 5: all tasks automated
USDOT, NHTSA, “Automated Driving Systems 2.0: A Vision for Safety,” DOT HS 812 442, September 2017
https://www.nhtsa.gov/sites/nhtsa.gov/files/documents/13069a-ads2.0_090617_v9a_tag.pdf
Information on Waymo autonomous vehicles: https://waymo.com/
Information on NURO autonomous vehicles: https://www.nuro.ai/
Slide 31:
Summary
Traveler Information
- Predominant use of mobile devices for data sources and information dissemination
- Multimodal applications
Mobility on Demand (MOD)
- Safe, reliable travel for all users
- Connected multimodal network
- Mobility as a Service (MaaS)
Emerging Applications
- Driver safety and convenience systems
- Connected Vehicles Technologies (V2V, V2I)
- Automated Vehicles
Author’s Slide 31 meeting notes below:
Real-time travel information assist travelers prior to their trip or while end route. Mobile devices are predominantly used for data sources and information dissemination
Mobility on Demand (MOD) is a framework to enable consumers to access mobility, goods, and services on demand by using public transportation facilities, shared mobility, delivery services through an integrated and connected multi-modal network.
Emerging vehicle technologies focus on cooperative vehicle infrastructure systems, vehicle-to-vehicle (V2V) and vehicle to infrastructure (V2I) communications, and automated vehicles (AV).
Return to top ↑