← Return to Module 6
ITS ePrimer Presentation
Module 6: Freight and Commercial Vehicle ITS
Slide 1:

ITS ePrimer
Module 6: Freight and Commercial Vehicle ITS
February 2022
ITS Professional Capacity Building Program
ITS Joint Program Office
U.S. Department of Transportation

Author’s Slide 1 meeting notes below:
These are the slides for the latest update of Module 6, Freight and Commercial Vehicle ITS.
This module is sponsored by the U.S. Department of Transportation’s ITS Professional Capacity Building (PCB) Program. The ITS PCB Program is in the ITS Joint Program Office (ITS JPO), within the Office of the Assistant Secretary for Research and Technology (OST-R).
Thank you for participating and we hope you find this module helpful.
Slide 2:
Author

Kenneth F. Troup, MS
Transportation Consultant Bolton, MA, USA
kefty@comcast.net
Author’s Slide 2 meeting notes below:
Ken Troup, along with his colleague Mike Wolfe, was co-author of the original 2014 Freight ITS Module and the 2016 Module 6 update. Ken is the sole author of this current 2022 version. Ken spent 33 years at the USDOT Volpe Center working in logistics analyses in support of USDOT, the Military Traffic Management Command, and the Defense Logistics Agency. Since 2005, he has worked as a transportation consultant supporting the Federal Highway Administration, the ITS Joint Program Office, and the Federal Motor Carrier Safety Administration. He was a long-time local official and supports his regional transit authority, local emergency medical technicians, and local access television station. He is also an amateur musician.
Slide 3:
Learning Objectives
- Provide an overview of supply chain and motor carrier freight operations.
- Describe recent freight automation advancements, future growth, and challenges.
- Identify resources for increased understanding of ITS freight applications.
Author’s Slide 3 meeting notes below:
This updated module provides an overview of ITS applications related to commercial freight truck operations and as promoted by the U.S Department of Transportation. Beginning with an explanation of supply chain management, this module explains how the trucking industry uses technology and how the industry works with elements of USDOT to facilitate safety and efficient operations. The module and the webinar describe recent freight ITS programs within the industry, within USDOT, and in cooperative efforts between USDOT and the industry to advance freight automation. The webinar emphasizes key industry-government efforts related to e-commerce, truck parking, and vehicle automation. This webinar also summarizes future directions of ITS research and some of the challenges that researchers face. In providing a high-level overview of freight ITS, the module and webinar identify resources that can provide readers with context and more detail about how the freight industry and the government cooperate in moving freight in the United States.
Slide 4:
Module Outline
- Supply Chain Management
- Freight Technologies
- Industry/government Interactions
- USDOT Freight ITS Program
- Benefits of Freight ITS
- Future Freight ITS
- Resources

Source: USDOT
All e-Primer modules accessible at /eprimer/
Author’s Slide 4 meeting notes below:
This outline shows the primary sections and organization of the updated freight ITS module. There is more detail in the sections than this webinar can cover; particularly in details of past and present USDOT freight ITS efforts and the benefits of ITS. The resources section includes more than 90 references that provide additional details about freight ITS. The link to the updated module and the other 15 modules in the ePrimer is shown.
Slide 5:
Supply Chain Management
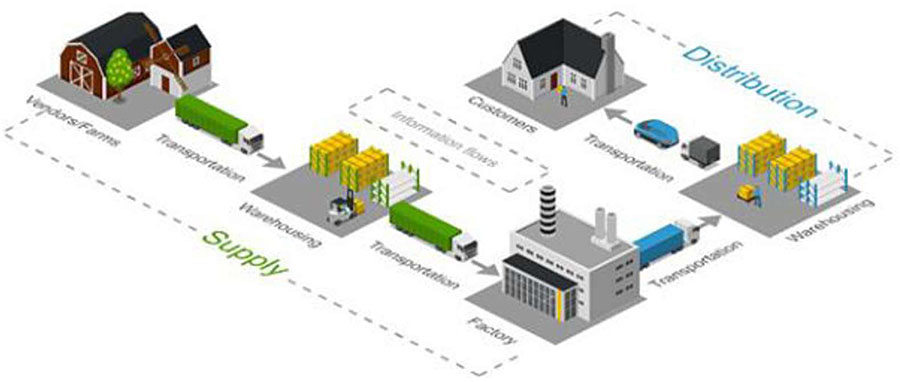
Source: Icograms.com modified by Kenneth Troup
Author’s Slide 5 meeting notes below:
The supply chain diagram shows a pictorial representation of a supply chain that moves shipments from manufactures to warehouses, distributers, and customers. Note that the trucks (and other modes, especially for international supply chains) play roles between each set of players. The essential players are the shipper, the carrier, and the receiver/consignee. Shippers tend to be manufacturers, wholesalers, or retailers. They originate freight shipments which vary in value, in number of shipments, or in size of shipments. Shippers buy carriers’ services. Carriers perform transportation operations and sell transportation services. Carriers (such as truck fleets) may be large firms or individual owner/operators that provide for-hire services. Private fleets are part of larger businesses that ship or receive cargo.
Consignees receive shipped items. As with shippers, consignees may be manufacturers, wholesalers, or retailers; shippers and consignees may even be parts of the same firm. Consignees can be the ultimate consumers of the goods being shipped and, particularly with the growth of e-commerce, a major interest area has developed with last mile delivery issues and strategies.
Slide 6:
Supply Chain Management
- Shippers - manufacturers, wholesalers, retailers
- Carriers - commercial fleets, independent truckers, private fleets
- Receivers/Consignees - shippers, warehouses, end customers
- Third Party Logistics (3PL) firms
- Timeliness, accuracy, completeness essential
- Technology and data help at each stage
- First and last mile are especially crucial
- Supply chain lecture at TRB 2022:
Source: Kenneth Troup
Author’s Slide 6 meeting notes below:
To provide better supply chain service and to find business niches, some supply chain functions between the shipper and the consignee have been integrated by firms known as third party logistics companies or 3PLs. This may involve warehousing, fulfillment centers, or arranging for transportation carriers. This outsourcing of logistics services helps the supply chain and 3PLs also implement ITS technologies to help them provide their services. More information about 3PLs is available in magazines such as Inbound Logistics and DC Velocity.
Timeliness, accuracy, and completeness of shipment delivery are usually crucial to the success of supply chain partners, even more so with increases in e-commerce. Shipment information is essential. In fact, with continued improvements and advances in ITS and online applications, the information associated with freight movement is as important as the cargo. The information is valuable in supply chain management and the broader use of ITS and traffic information that helps reduce impacts of congestion on transportation networks.
Last mile has become larger than just urban focused as more and more parcels are delivered directly to consumers, sometimes as a regular part of USPS mail delivery and throughout metropolitan and suburban areas. Delivery trucks and their delivery schedules are impacted by urban traffic congestion.
It is worth highlighting a recent lecture presented at the 2022 TRB Annual Meeting.
Anne Strauss-Wieder provided an excellent history of supply chain changes in the last 50-60 years. The lecture with many interesting photos is available on YouTube.
Slide 7:
Supply Chain Management Technology
- Shipment status data
- Carrier management - truck location, routing, and order management
- Truck-specific navigation systems - low bridges, hazmat
- Shipment visibility
Source: USDOT
Author’s Slide 7 meeting notes below:
Shippers, consignees, and logistics service providers have made important and substantial improvements in supply chain data quality and accessibility. Parcel delivery firms such as United Parcel Service (UPS) and Federal Express (FedEx) were among the first to provide an individual customer with precise information about the status of a shipment. Amazon and similar suppliers introduced free shipping and took supply chain data to a new level.
Carriers use ITS and freight management data in managing transportation assets, whether they are a fleet of tractors, intermodal containers, truck trailers, or labor management. The technology and online communications combined with GPS help in maintaining truck location information and help with individual truck routing and identifying and planning the next and later loads to help plan the driver’s day.
Truckers should use navigation systems from such ITS vendors as Tom Tom, PC-Miler, INRIX AI, Trimble MAPS, and PTV because they include freight-specific information such as bridge height and route restrictions applicable to trucks, designated truck route, and hazardous materials route restrictions. These are all things that are not in the passenger vehicle or cell phone-based navigation systems the non-trucking community uses.
Shipment visibility uses transaction and status data available on carrier websites or other Internet data links and could trigger alerts for supply chain partners if there are delays or unexpected changes in shipment plans could.
Slide 8:
E-Commerce
- Smaller shipments directly to customers
- Increased emphasis on last mile
- Creates more complicated supply chains
- Parcel delivery by UPS, FedEx, and USPS
- Free shipping and rapid delivery
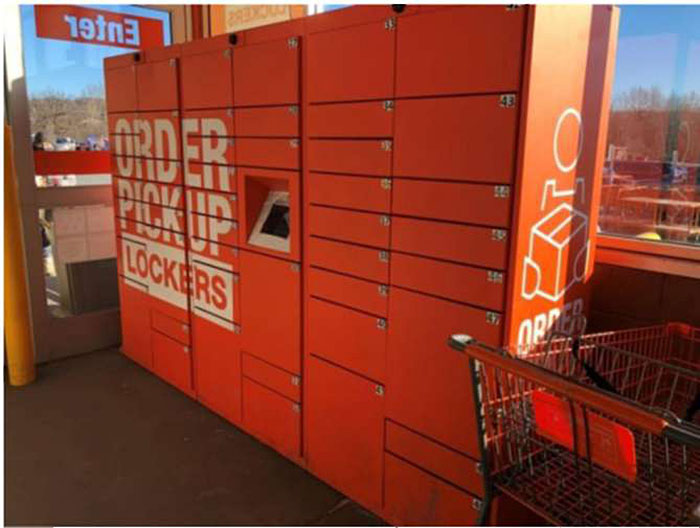
Source: Kenneth Troup - Lockers at a Retail Store
Author’s Slide 8 meeting notes below:
As e-commerce has grown, the trend has been for smaller, more frequent shipments and a shift toward parcel shipping away from traditional, less-than-truckload (LTL) or larger shipments, with an increased emphasis on timeliness of delivery. That became particularly important during the pandemic when consumers were forced to stay home and ordered substantially more items to keep their households functioning. In addition, timeliness of shipments has become more important, building in part on the popularity of free shipping and then even same day shipping by e-commerce firms. Shipper and carrier transportation management systems (TMS) evolved to support parcel shipping, a departure from earlier truckload (TL) and LTL focus.
It is worth noting that the U.S. Postal Service (USPS) plays a significant role in e-commerce, particularly for small parcels under 2 pounds and for deliveries to rural areas where commercial e-commerce deliveries have higher rates. USPS also plays a role in final delivery in conjunction with some commercial e-commerce carriers. According to the 2021 E-Commerce Consumer Survey released by 3PL Kenco Logistics in July 2021, e-commerce purchases, some of which were picked up in-store, in 2020 grew by 33 percent to $792 billion, representing 14 percent of all retail sales. 84 percent of responders say they will continue at e-commerce levels post-pandemic.
Slide 9:
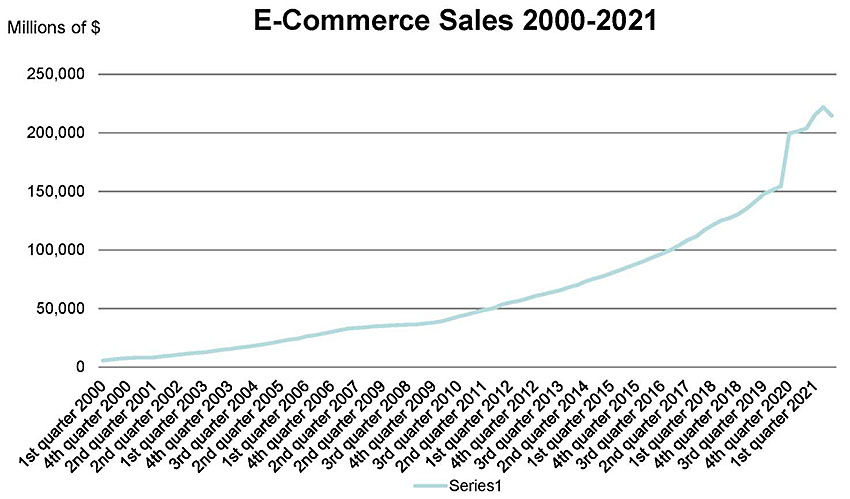
Growth of e-commerce
Source: Kenneth Troup from US Census data
Author’s Slide 9 meeting notes below:
The diagram shows the steady growth of e-commerce for the last 20+ years. This growth has led to more and smaller e-commerce fulfillment centers to meet consumer demand and delivery requirements. Some fulfillment centers had to take on more of the work previously handled by parcel carriers including sorting packages for ZIP code zones for regional carriers to transport packages to local markets. This involved implementing technology that can sort packages by size, weight, and ZIP code zone. Further, some shipper TMSs have the capability to account for cost and open capacity of the parcel carriers when making the carrier decision.
Slide 10:
Supply Chain in the Pandemic
- Consumers stayed home and ordered more
- “Supply Chain” became a household word
- Operational and coordination challenges for suppliers and carriers in United States and worldwide
- Increased demand for last mile delivery
- Accelerated interest in technology
- Improved visibility
- Automation of freight movements
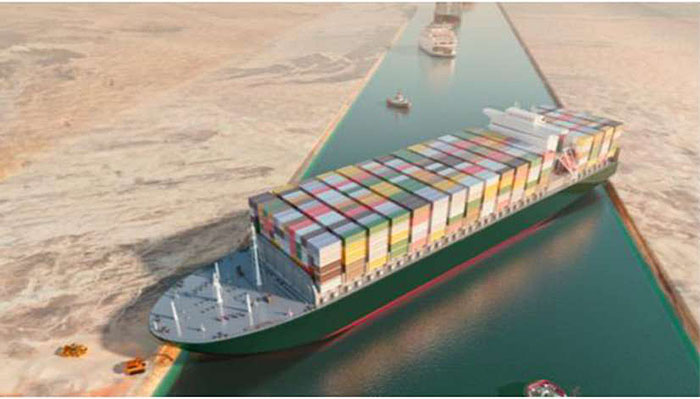
Source: shutterstock_1943891122 - Ever Given
Author’s Slide 10 meeting notes below:
The global COVID-19 pandemic in 2020-2022 emphasized the importance of efficient supply chain management. It affected manufacturers and distributors, which sometimes caused shortages of items consumers wanted. These effects led to supply chain uncertainties and “Supply Chain” became a household word. There were countless operational and coordination challenges to suppliers as well as carriers. The infamous Ever Given running aground in the Suez Canal in March 2021 affected supply chains around the world. The Ports of Los Angeles experienced vastly longer delays of container ships entering the harbor.
As noted earlier, the shift to parcel shipping for e-commerce put strains on the parcel carriers. Touchless delivery related to consumers staying home or retailers not being open for normal business exacerbated the demands for last mile delivery, often to in-store delivery lockers or lockers operated by Amazon or Walmart and other retailers.
For carriers with Class 8 semi-trailers, the pandemic further exacerbated the truck parking shortage, as a number of states closed public rest areas, removing capacity from an already constrained system.
On the plus side, there was accelerated interest in technology that improves visibility and automation of freight movements and sometimes to create new supply chain partners to work around delays and problems.
Slide 11:
Supply Chain in the News
Inbound Logistics December 2021 - Readers Weigh In
“How would you summarize the supply chain in 2021 in five words?”
- Biggest Dumpster Fire Ever
- Global, Volatile, Long, Expensive, Recovering
- A Slow Moving Goat Rodeo
- Opportunity to Improve Business Strategies
- Drinking From a Fire Hose
- We Need Operational Resilience Now
- Crisis Exposed Need for Visibility
- Much Ado About Nothing Delivered
- Adapt and Innovate to Survive
- Ripe for Digital Disruption
Author’s Slide 11 meeting notes below:
Inbound Logistics is a trade press magazine that covers supply chain partners and has articles, surveys, and information about freight movement and distribution services and technologies. It frequently has interviews with supply chain officials in various kinds of companies and also has a monthly feature of readers responding to a supply chain-related question.
The December 2021 issue’s Readers Weigh In section was very apropos to the kinds of supply chain information this webinar covers. The question was “How would you summarize the supply chain in 2021 in five words.” The answers provided were clever, in some cases funny, and nicely captured some of the issues that were mentioned on some of the previous slides.
The Slide here has 10 of the reader responses and provides a nice segue to more detailed discussion of the technologies that help with the supply chain.
Slide 12:
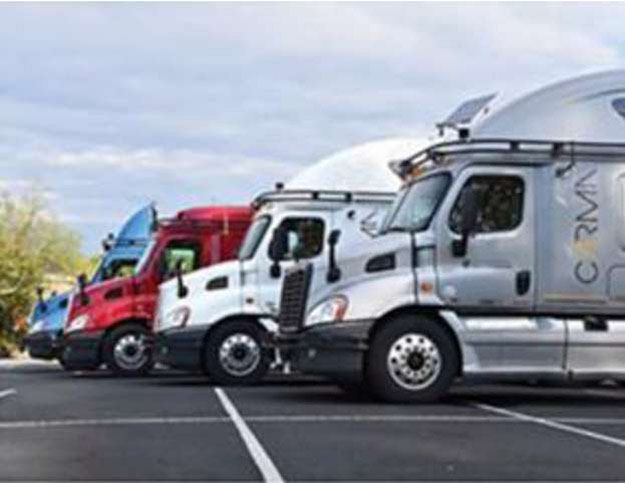
Truck Parking
- Number one problem to truckers
- Closely related to hours-of-service rules and ELDs
- Public and private parking areas used
- Industry-government work together on technology assistance in finding existing spaces
- Numerous state and regional parking initiatives
- Three-part article in FleetOwner
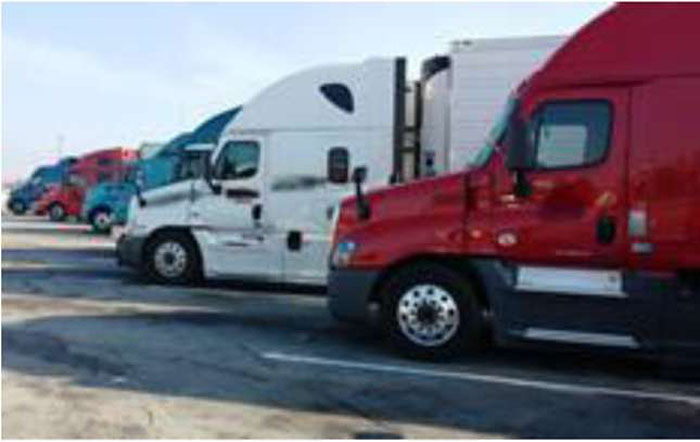
Source: FHWA Truck Parking
Author’s Slide 12 meeting notes below:
The availability of truck parking is an important problem for both the trucking industry and the traveling public. In ATRI surveys, truck parking is the #1 problem among truckers themselves and in the top 10 for all industry respondents. Truck parking is an increased problem because of recent emphasis on rest periods in the hours-of-service rules and with the requirement for truckers to use electronic logging devices to record and report their hours. Unlike some aspects of trucking or the supply chain, technology itself cannot provide more parking spaces.
However, states and other agencies have developed Truck Parking Information Management Systems that use ITS to collect and disseminate information on the availability of truck parking. These systems collect data on parking availability with equipment installed in rest areas to detect vehicles occupying parking spaces or counting vehicles as they enter or leave a rest area. This is used to identify available parking and disseminate the information to drivers through state 511 websites, dynamic messaging signs, and smartphone applications. There are private systems operated by truck stop operators, private firms, and public agencies. Data for the parking information systems may be sourced from the truck stops, crowdsourced, or sourced from paid parking providers. Individual truckers, or their company dispatchers, can use the availability information to plan their routes and reserve spaces in advance. An interesting three-part article in FleetOwner provides additional information about what technology providers are doing to help address the parking issue.
Slide 13:
Truck Parking Availability Technology Projects - 2018
| Project |
Caltrans |
Minnesota DOT |
Colorado DOT |
Florida DOT |
Michigan DOT |
I-95 Corridor Coalition |
MAASTO |
Wisconsin DOT |
Tennessee |
| Funding Agency |
FHWA and Caltrans |
MNDOT and FHWA |
Federal Funding and Colorado DOT |
FHWA and FDOT |
FHWA and MDOT |
FHWA, MDOT, and VDOT |
USDOT through TIGER grants. |
Initially funded by FHWA. It is now part of the MAASTO TIGER grant. |
FMCSA and TDOT |
| Partners |
California DOT, UC Berkeley Transportation Sustainability Research Center, ParkingCarma and NAVTEQ. |
Minnesota DOT, University of Minnesota’s Center for Transportation Studies, ATRI. |
Colorado DOT |
Florida DOT |
Michigan DOT |
I-95 Corridor Coalition is a partnership of transportation agencies, toll authorities, public safety, and related organizations from Maine to Florida. |
Eight MAASTO states; Indiana, Iowa, Kansas, Kentucky, Michigan, Minnesota, Ohio, and Wisconsin. |
Wisconsin DOT and TAPCO. |
FMCSA and the State of Tennessee. |
| Location |
One privately owned site on I-5. |
Three public rest areas along I-94. It will also integrate with the Wisconsin I-94 system. |
Six locations during the first phase, with a final goal of deploying across the state on I-25, I-70 and I-76 |
Seven rest areas and weigh stations along I-4 and I-95 are scheduled for phase 1. A total of 68 locations will be active by April 2019. |
Seven private truck stops and five public nest areas. |
Testing was done at rest areas on I-95. Currently, the system is active at two rest areas in I-95 and two more on I-64 Virginia. |
The system will be deployed in major corridors in member states. |
Four rest areas along the I-94 corridor. It will integrate with the Minnesota I-94 system. |
Two rest areas. |
Author’s Slide 13 meeting notes below:
Table Source: “Truck Parking Availability Detection and Information Dissemination,” National Coalition on Truck Parking Technology and Data Working Group 2018.
FHWA helped form a National Coalition on Truck Parking that includes public and private sector organizations with an interest in advancing safe truck parking. The Coalition brings together stakeholders from the trucking industry, commercial vehicle safety officials, state DOTs, MPOs, and commercial truck stop owners and operators, most recently at a virtual meeting in December 2021.
The table on this page was taken from a USDOT-sponsored effort to standardize the approach to truck parking availability systems. It lists some of the state or regional truck parking efforts and systems that were underway in 2018. More information can be found in the noted source document as well as on the FHWA website.
The links to the FleetOwner articles on the previous Slide are the following:
Part 1 Tech Providers Aim to Ease Truck Parking Concerns with Real-time Information
Part 2 Truck Stops Step Up To Combat Parking Crisis
Part 3 Using Reservations Ensuring Safety Part of Solving Truck Parking Crisis
Slide 14:
Truck Technologies
- ADAS
- ADS Level 4
- Electric trucks
- Logging devices and virtual weigh stations
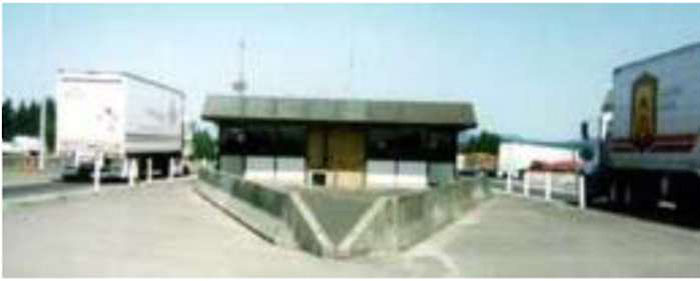
Source: FMCSA virtual weigh station
Source: USDOT V2V communications
Author’s Slide 14 meeting notes below:
These are some technologies that are currently being used by or considered for use by trucking firms. They are discussed in more detail in subsequent slides. ADAS is Advanced Driver Assist System; technologies that are already available on many new trucks and increasingly used within the industry. More on that in the next slide. An objective we’ll discuss in more detail is Automated Driving Systems or ADS which are being pursued in current research and demonstrations at SAE International Level 4 in which a driver is behind the wheel but is usually not needed or Level 5 in which a truck is truly self-driving. The slides also discuss technologies now used to record drivers’ hours and to facilitate state and Federal inspection requirements through ITS technologies.
Although electric trucks are not ITS technologies per se, they are an important technology that would have major effects on the truck industry. The slides will talk about what some tech firms and truck manufacturers are working on to develop electric trucks of varying sizes for medium haul as well as first or last mile requirements.
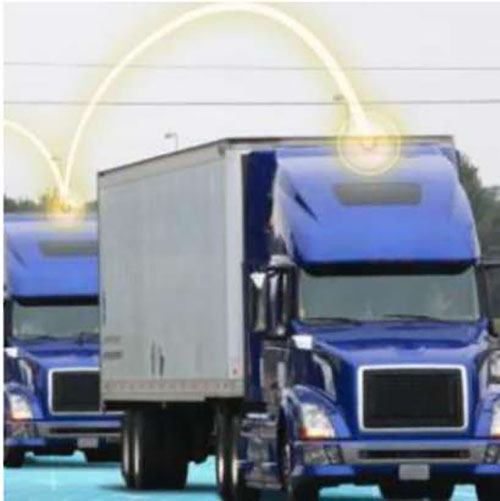
Slide 15:
Truck Automation - ADAS
- ADAS - Advanced Driver Assist System
- Adaptive cruise control
- Lane keeping assist
- Automated emergency braking
- Active warning systems
- Tech-Celerate NOW - USDOT/Industry effort
Source: FMCSA
Author’s Slide 15 meeting notes below:
Advanced Driver Assist System (ADAS) involves a series of truck-based automation technologies that provide information or device operations to assist a truck driver and potentially improve safety of truck operations. These include the following:
Active Braking Systems, including automatic emergency braking, air disc brakes, and adaptive cruise control (ACC) to maintain a preset distance between the truck and the vehicle in front.
Active Steering Systems, which include lane keep assist, lane centering, and adaptive steering control.
Active Warning Systems, including lane departure, forward collision, and blind spot detection. These warn the driver of an impending crash through both audio alerts and pulses on the driver’s seat.
Camera Monitoring Systems, which include in-cab facing driver training, forward facing event recording, and side rear view mirrors.
In conjunction with the American Trucking Associations, the FMCSA and the ITS JPO in 2020 created a joint program to promote ADAS in the trucking industry. Called Tech-Celerate NOW, the joint effort involves “Accelerating the Adoption of Advanced Driver Assistance Systems (ADAS).”
Slide 16:
Truck Automation - ADS
- Level 4 ADS - Automated Truck with a safety driver who can take over driving when needed.
- Demonstrations move the technology forward. Examples:
- Uber/Otto - 2016 Beer trailer
- Kodiak - Start up and trucking company -2020 “fully disengage-free day”
- Waymo and UPS - Houston - Fort Worth corridor
- Aurora with PACCAR and FedEx - I-45 in Texas
- TuSimple - 80-mile nighttime run on I-10 in Arizona without the driver touching the steering wheel
Author’s Slide 16 meeting notes below:
Some limited L3 and L4 automation have been piloted by various technology companies and some of their trucking company allies. In 2016, Uber/ Otto tested the first L4 truck in automated mode in real-world conditions, pulling a trailer containing 50,000 cans of Budweiser beer 120 miles on I-25 in Colorado.
Kodiak was a start-up that developed both the automation technology and a trucking company moving freight in Texas. In December 2020, they drove an L4 truck in what they termed a “fully disengage-free day,” completing two round-trips in a row, over 800 miles straight on I-45 between Dallas and Houston. Later in 2021, Kodiak announced its plans to move freight on a 273 mile stretch of I-35 in Texas, again L4 with only a safety driver.
Waymo is working with JB Hunt as well UPS on I-45 between Houston and Fort Worth to deliver freight in autonomous mode L4 with two safety drivers. In a similar vein, automation company Aurora is teaming up with PACCAR and FedEx to pilot a few L4 trucks in a 500-mile corridor in Texas.
In December 2021, TuSimple announced that it successfully completed an 80-mile nighttime run on I-10 in Arizona without the driver touching the steering wheel. A Class 8 truck left a large rail yard in Tucson, Arizona, on Dec. 22 and covered surface streets and highways for an hour and 20 minutes before safely arriving at a high-volume distribution center in the Phoenix metro area. TuSimple says it has logged 160,000 in L4 testing. (See https://progressivegrocer.com/self-driving-semi-completes-trip/.) .
Slide 17:
Electric Trucks
- Truck manufacturers/tech firm efforts - examples
- Volvo, Nikola, Tesla, Lion
- UPS and other electric delivery trucks
- Run for Less demonstration
- Lower ownership costs
- Reduced pollution
- Need for charging stations
Author’s Slide 17 meeting notes below:
There is growing interest in the motor carrier industry in electric trucks. While there has been some deployment in the smaller delivery vehicles such as UPS and FedEx, electric Class 8 tractors are relatively new and being introduced in pilot or small-scale runs. Suppliers include Volvo with an electric Class 8 truck that is being purchased by a food distribution company in Southern California. With a battery range of 150 miles, it works for a day of local deliveries. Nikola Trucks sells both delivery and Class 8 electric trucks with a 250-mile range for short haul and metro-region deliveries. Lion has both Class 6 and Class 8 trucks with about 260-mile range and Daimler sells a Freightliner truck called eCascadia with similar mileage. Tesla is planning to deliver its new semi electric trucks during 2022. Success of all these trucks depend on charging station installations.
An interesting event in September 2021 shows the growing interest in electric trucks. Thirteen different electric trucks of varying size and configurations from various companies drove their regular routes for 3 weeks, measuring their efficiency and operating situations. The principal objective was to reduce carbon emissions. In the views of some observers, it is quite feasible to use electric van/step van, medium-duty box truck, terminal tractor, and short heavy tractor regional delivery market segments. (https://runonless.com/run-on-less-electric-demonstrates-co2-saved-with-electric-trucks/). All of this was part of Run on Less, a program aimed at measuring efficiency in trucking that is collaboration between the North American Council for Freight Efficiency (NACFE) and the Rocky Mountain Institute (RMI). Continued research and implementation of charge stations will increase the feasibility in the longer haul heavy tractor market segment.
Slide 18:
USDOT Safety Compliance Technology
- FMCSA - Safety Compliance
- Virtual weigh stations
- Truck size and weight
- ELDs and hours of service
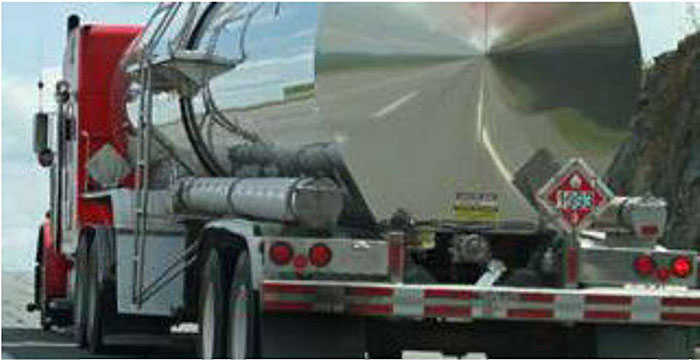
Source: FMCSA
Author’s Slide 18 meeting notes below:
Trucks have on-board sensors and devices to collect operating information that can be used for reporting compliance with hours of service, truck inspections, and to monitor truck safety. They also have technology for communicating with weigh stations, including the ability to bypass physical inspection locations.
Electronic Logging Devices (ELDs) became a requirement in 2017 and replaced manual reporting to FMCSA of hours worked. Smart phone apps have been implemented. ELDs capture engine data, location, speed, and miles driven. Trucks made before 2000 are exempt. FMCSA requires ELD for Record of Duty Status and Hours of Service.
Slide 19:
Past USDOT Freight Research
- Connected Vehicle Technology (V2V, V2I)
- Truck V2V Research
- Truck V2I/Smart Roadside
- Dynamic Mobility Applications and Demonstrations (FRATIS, RESCUME)
- CVISN Core and Advanced Deployment Program, now ITD state initiatives
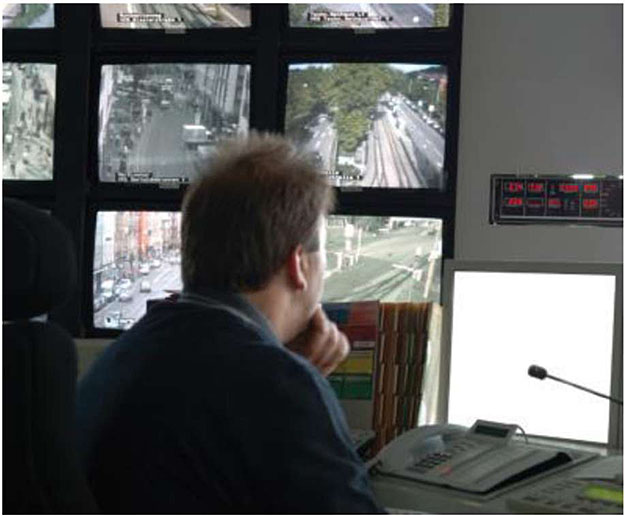
Source: ITS JPO - Traffic Management
Author’s Slide 19 meeting notes below:
Previous versions of the ITS Freight Module included descriptions of ITS demonstrations and implementations related to freight. This updated version reviews some of the past projects and, in some cases, how they have morphed into new USDOT programs. 10 or more years ago, USDOT was at the forefront of research in V2V and V2I communications, both on the passenger and freight side. They sponsored three connected vehicle pilots, one of which was a freight effort on I-80 in Wyoming. Through ITS JPO’s Dynamic Mobility program, there were several freight demonstrations called Freight Traveler Information Systems (FRATIS) involving truck access to ports or intermodal terminals and sharing of shipment data amongst stakeholders. There are references to these projects in the resources section of the module. CVISN, also known as Commercial Vehicle Information Systems and Networks, was an FMCSA program that involved technology to assist with electronic verification of commercial motor vehicle credentialing and weight of commercial vehicles at participating state highway weigh stations. The CVISN program has now been replaced by the Innovative Technology Deployment (ITD) program which provides financial assistance to advance the technological capability and promote the deployment of ITS applications for motor carrier operations, through funding to state DOTs.
Slide 20:
Current USDOT Freight Research
Research Organizations
- FHWA Freight Management and Operations
- ITS JPO CARMA Freight - drayage operation improvements
- FMCSA Automated Commercial Motor Carrier Evaluation - facilitate ADS electronic safety inspections
Current Activities
- ADAS - Tech-Celerate NOW
- Cooperative ADS - California PATH
- ADS Grants - Ohio ADS Platooning
- ATCMTD Grants - Automated demos on state corridors
Author’s Slide 20 meeting notes below:
The FHWA’s Freight Office’s Freight Management and Operations program is to “promote the deployment of technology and the adoption of best practices to facilitate the smooth flow of goods on the Nation’s transportation system and across our borders.” FHWA works with ITS JPO that sometimes separately funds freight research; for example, the Wyoming connected vehicle pilot mentioned previously.
CARMA is another ITS JPO program that, in the case of freight, works on improving drayage operations at ports with research into automated vehicles. FMCSA provides Federal financial assistance via Motor Carrier Safety Assistance Program grants (MCSAP) to enhance commercial vehicle safety plan (CVSP) activities and administers the Innovative Technology Deployment program of grants to states.
Some specific freight efforts worth mentioning include the following: The current USDOT efforts in ADAS include its support of the Tech-Celerate NOW effort discussed earlier.
The California PATH year-long FHWA-sponsored platooning demonstration with a trucking company in California, which will include night operation, is to collect and analyze platooning operations data that should help with future improvements of the technology. The Ohio ADS grant will involve L1 and L2 trucking fleet operation and potential platooning on less-than-interstate quality roads.
Established under the FAST Act, the Advanced Transportation and Congestion Management Technologies Deployment (ATCMTD) program works to improve the performance of U.S. transportation systems, reduce traffic congestion, and improve the safety of the traveling public. Some of the freight grants have looked at connected freight corridors such as I-45 in Texas and automated vehicle use at ports.
Slide 21:
Freight Data
- Industry uses - tracking, fleet management, e-commerce
- Governmental uses - planning, oversight
- Freight network improvement - government reporting, network analysis, freight research
FHWA - Performance Data
Author’s Slide 21 meeting notes below:
The center of the earlier Supply Chain diagram had a box in the middle titled “information flows.” Information about what is moving is often as important as the freight itself. Shippers, carriers, and consignees use digital technology to manage the supply chain, keep each other informed, and provide electronic information about what freight is moving. E-commerce needs the flow of information to succeed.
At a higher level, freight data is useful to the supply chain partners, to state and local governments, and to the Federal government for planning, forecasting, and understanding the performance of the supply chain.
Freight planning at the state or regional level is important so that transportation carriers can do their jobs in a safe and efficient manner. The impacts of freight movement, both positive to a local economy and negative with respect to traffic or fuel consumption or air quality, are important to states and localities and the infrastructure they operate and maintain.
The FHWA Office of Freight Management and Operations promotes freight and sponsors research to improve performance of the freight system. This includes freight performance monitoring and the identification of bottlenecks on the National Highway System. One of FHWA’s programs for performance monitoring is the Freight Fluidity Measurement project. Freight fluidity refers to the performance of transportation supply chains and freight networks.
Slide 22:
USDOT Freight Data Projects
- FAF 5
- Performance Monitoring
- Performance measures per FAST Act
- Freight Fluidity
Source: Bureau of Transportation Statistics FAF5
Author’s Slide 22 meeting notes below:
The Freight Analysis Framework (FAF), produced through a partnership between BTS and FHWA and now in its fifth edition, called FAF5, integrates data from a variety of sources to create a comprehensive picture of freight movement among states and major metropolitan areas by all modes of transportation.
The major data source for FAF5 is the BTS Commodity Flow Survey (CFS) that is compiled every 5 years. Other major data sources include Census Foreign Trade Statistics, Economic Census data, Department of Agriculture’s Census of Agriculture, Vehicle Inventory and Use Survey (VIUS), National Highway Planning Network (NHPN), Highway Performance Monitoring System (HPMS), Energy Information Administration (EIA), and other industrial data. Through the cooperative work at FHWA and BTS, FAF5 has a downloadable dataset, 30-year forecasts, estimates of truck flows on the highway network, and other mapping products. FAF5 is used extensively by state DOTs and researchers and is a basis for some commercial freight movement database products such as Transearch.
FHWA also works with BTS to collect data that can be used for performance monitoring. As part of the FAST Act, FHWA is required to establish performance measures which states and metropolitan planning organizations (MPOs) use in their operations and coordinate with FHWA. As noted on the previous slide, these and other data are used in freight fluidity network analysis.
Slide 23:
TRB Freight Data Efforts
- Freight Data and Urban Freight Committees
- Improvements in Freight Data workshops
- Data sharing
Source: Bill Eisele
Author’s Slide 23 meeting notes below:
The Freight Data Committee brings together academic, consulting, industry, and government to discuss uses of freight data and to assist each other in sharing data and analysis results to improve freight movement across the United States and Canada. The Urban Freight Committee examines urban problems such as last mile delivery and uses freight data in its research. There are frequent presentations and discussions at TRB Freight Data Committee meetings and workshops of innovative and productive data analyses that transportation researchers have conducted, usually starting with FAF5 or its predecessors. More information about freight data is available at https://freightplanning.org/data/. The third Innovations in Freight Data Workshop was completed in September 2021 and included several presentations that, as a minimum, will be covered in printed proceedings of the workshop when published by TRB. TRB also sponsors projects to develop guidebooks and analysis reports about the use and sharing of freight data.
Slide 24:
CBP Land Border Customs Enforcement and Automated Systems
- Customs-Trade Partnership Against Terrorism (C-TPAT)
- Voluntary program to promote adoption of security best practices among shippers, carriers, consignees, and their supply chain partners
- Similar programs in Canada and Mexico
- Importer Security Filing - automated advanced filing
- Importer provides 10 essential data elements of container & contents
- Carrier provide vessel stow plan and container status messages
- Automated Commercial Environment (ACE)
- Web-based system for filing imports across land borders for motor carriers
- Automated Broker Interface for electronic filings
Author’s Slide 24 meeting notes below:
After 9/11, in 2001, the United States government led international efforts to secure the supply chain when U.S. Customs and Border Protection (CBP) introduced three programs. The Customs-Trade Partnership Against Terrorism (C-TPAT), a voluntary program, continues to promote adoption of security best practices among shippers, carriers, consignees, and their supply chain partners; CBP reviews corporate security plans and periodically validates compliance by inspection.
The Container Security Initiative (CSI) “pushed out the borders” with prescreening of U.S.-bound container cargoes at selected originating ports. Since 2009, CBP has had an Importer Security Filing requirement, commonly known as “10+2.” The current rule requires ocean carrier importers to provide 10 essential data elements about a container and its contents, and carriers must provide two items (the vessel stow plan and container status messages).
CBP operates the Automated Commercial Environment (ACE) Secure Data Portal and EDI Filing required for all imports coming across land borders by motor carriers. The Secure Data Portal is a free, web-based access point designed to connect CBP with trade partners. It uses the standard EDI documents for international trade to help clear the inbound freight. The freight data involved in these imports is a crucial part of motor carrier activities with Canada and Mexico. Managing, processing, and transmitting that freight data has become a business itself as software developers developed and sell programs that meet CBP requirements.
Slide 25:
Benefits of Freight ITS
Author’s Slide 25 meeting notes below:
The benefits section of the module provides a general discussion of benefits to industry, government, and society from freight ITS technology applications, with specific examples or references where available, particularly involving recent research into automated vehicles. The section also includes several references to tools or past work that can be drawn upon when deriving benefits for specific projects or technologies. Of particular note and assistance to readers and project planners—ITS JPO has a webpage devoted to benefits of ITS (https://www.itskrs.its.dot.gov/benefits). It lists the six benefit areas for ITS as shown on the slide. The website has two freight-oriented topic areas, one about commercial motor vehicles with numerous citations and references to benefits reports.
A potential tool or resource that readers can access to help them determine benefits is the Tool for Operations Benefit-Cost Analysis (TOPS-BC), developed by the FHWA Office of Operations at
https://ops.fhwa.dot.gov/plan4ops/topsbctool/index.htm70. TOPS-BC is a sketch-planning level decision support tool.
Some of the benefits of the technologies discussed earlier in the slides are noted here. Truck automation is expected to improve safety and increase the productivity of drivers and trucking companies. Freight information and ITS tools help supply chain partners do their jobs more efficiently and help provide better customer service. Electric trucks as well as more efficient operations will reduce greenhouse gases and reliance on fossil fuels.
Slide 26:
Future Freight Research
- L4 Automated Vehicles
- ADAS and ADS
- Cooperative ADS and increased truck platooning
- Smart corridor and similar infrastructure
- Electric trucks
- Last Mile robotic delivery vehicles
- Freight data sharing and coordination
- Workforce implications
Author’s Slide 26 meeting notes below:
These are some of the areas of ongoing and future research in freight ITS that are further discussed in the Module. We already mentioned the DOT-industry effort to spread ADAS technologies and that is likely to continue and have further implementation. Both public and driver acceptance of L4 and higher automation of trucks (human driver involved only when requested) will be needed even as research and further demonstrations continue.
There is ongoing research that helps to provide highway information to both auto and commercial freight vehicles; I-10 and I-45 in Texas for example. Such information can eventually help truckers operate more efficiently.
Electric truck research will continue to improve batteries, both for lowering cost and increasing mileage range. And of course, more available charging stations. Research is likely to continue within the tech companies and some of the parcel delivery companies on automation of freight deliveries.
Another future ITS research area is to further understand and quantify the expected impacts freight automation may have on such issues as driver shortages and driver retention, two issues identified by motor carriers and drivers in ATRI surveys. A TRB report will be issued in March 2022 on automated freight vehicles. USDOT, TRB, and the industry will need to collaborate to facilitate widespread penetration of new technologies as they become available.
Slide 27:
Summary
What we’ve learned:
- Supply chain management is important to the United State and world economy and has been tested during the pandemic.
- All parties to the supply chain use and benefit from freight ITS and freight data
- Technology shows promise for helping address trucking industry problems including truck parking
- ADAS is being used and implemented now, with Tech-Celerate NOW an important advocacy program
- ADS has been demonstrated on Texas and Arizona interstates; research and demonstrations will continue
- Electric trucks are being implemented, but need charging stations for widespread implementation
Author’s Slide 27 meeting notes below:
In this webinar and the updated Freight ITS module, we have explored supply chain management and the trucking industry’s key role in that, and we have looked at some of the ITS technologies that are being used and/or developed and demonstrated in industry/government pilot projects.
We have looked at the cooperative relationship between governments and the freight industry and at some of the improvement efforts that have been undertaken, often with public funds. The module provides an overview of some of the past USDOT programs as well as current efforts underway to enhance truck automation and electrification. One of those current efforts, the Tech-Celerate NOW program, involves cooperation between the American Trucking Associations and USDOT to implement automation technologies that aid the driver and improve safety today. Meanwhile, looking to the longer term, the tech companies are working with motor carrier equipment manufacturers to develop automated and electric trucks that may eventually help relieve the driver shortage, further automate the supply chain, and help reduce reliance on fossil fuels.
There have been many technology advances since the 2016 update of Module 6 and the next update will undoubtedly document continued progress in automating various parts of the supply chain.
Slide 28:
References
Author’s Slide 28 meeting notes below:
As noted earlier, Module 6 has more than 90 links to various reports and articles related to freight ITS as well as 17 Additional Resources. The reports and websites on this Slide are highlights from the references in Module 6. With the exception of the State of Logistics Report 2020, these references are available online. The Logistics Report has a fee unless the reader is a member of the Council of Supply Chain Management Professionals. The seven references here are representative of what is included in the module and specifically provide details beyond what has been introduced in the webinar slides.
Slide 29:
Acknowledgements
- I. Michael Wolfe, original co-author
- Niloo Parvinashtiani, ITE, and rest of ITE team
- ITS JPO’s PCB program and USDOT coordinators and reviewers
- Dan Murray, ATRI
- Dan Smith, Tioga Group
- Bill Eisele, Texas A&M Transportation Institute
Author’s Slide 29 meeting notes below:
This is the second update of Module 6 since the original was co-authored by Mike Wolfe and the current author Ken Troup. Niloo Parvinashtiani, module editor Deborah Rouse, and additional ITE staff, including the coordinators and reviewers from USDOT, provided important guidance and feedback to Ken Troup in completing this update of Module 6 and the webinar. The three industry experts listed were important reviewers of early drafts of the module and their expertise and views are very much appreciated.
Return to top ↑